Linux Perf 1.3、software events

可以通过perf list命令来查看系统中的software event:

1
2
3
4
5
6
7
8
9
10
11
# simpleperf list sw
List of software events:
cpu-clock
task-clock
page-faults
context-switches
cpu-migrations
minor-faults
major-faults
alignment-faults
emulation-faults

1、原理介绍:

software pmu的trace数据抓取分为两类:“cpu-clock”、“task-clock”为采样法,其他为插桩法。

1
2
3
4
5
6
7
8
9
10
11
12
13
14
15
enum perf_sw_ids {
PERF_COUNT_SW_CPU_CLOCK = 0,
PERF_COUNT_SW_TASK_CLOCK = 1,
PERF_COUNT_SW_PAGE_FAULTS = 2,
PERF_COUNT_SW_CONTEXT_SWITCHES = 3,
PERF_COUNT_SW_CPU_MIGRATIONS = 4,
PERF_COUNT_SW_PAGE_FAULTS_MIN = 5,
PERF_COUNT_SW_PAGE_FAULTS_MAJ = 6,
PERF_COUNT_SW_ALIGNMENT_FAULTS = 7,
PERF_COUNT_SW_EMULATION_FAULTS = 8,
PERF_COUNT_SW_DUMMY = 9,
PERF_COUNT_SW_BPF_OUTPUT = 10,

PERF_COUNT_SW_MAX, /* non-ABI */
};

1.1、插桩法

插桩法的software event和tracepoint event本质上是一样的,只是tracepoint event是复用trace_event,而software event是重新创建的插桩点。

  • 1、“page-faults”的插桩点:

el0_sync() -> el0_da() -> do_mem_abort() -> do_mem_abort() -> do_page_fault():

1
2
3
4
5
6
7
8
static int __kprobes do_page_fault(unsigned long addr, unsigned int esr,
struct pt_regs *regs)
{

/* “context-switches”的插桩点,被命中时上报数据 */
perf_sw_event(PERF_COUNT_SW_PAGE_FAULTS, 1, regs, addr);

}
  • 2、“context-switches”的插桩点:

context_switch() -> prepare_task_switch() -> perf_event_task_sched_out():

1
2
3
4
5
6
7
8
9
static inline void perf_event_task_sched_out(struct task_struct *prev,
struct task_struct *next)
{
/* “context-switches”的插桩点,被命中时上报数据 */
perf_sw_event_sched(PERF_COUNT_SW_CONTEXT_SWITCHES, 1, 0);

if (static_key_false(&perf_sched_events.key))
__perf_event_task_sched_out(prev, next);
}
  • 3、“cpu-migrations”的插桩点:

context_switch() -> finish_task_switch() -> perf_event_task_sched_in():

1
2
3
4
5
6
7
8
9
10
11
12
13
14
15
static inline void perf_event_task_sched_in(struct task_struct *prev,
struct task_struct *task)
{
if (static_key_false(&perf_sched_events.key))
__perf_event_task_sched_in(prev, task);

/* “cpu-migrations”的插桩点,被命中时上报数据 */
if (perf_sw_migrate_enabled() && task->sched_migrated) {
struct pt_regs *regs = this_cpu_ptr(&__perf_regs[0]);

perf_fetch_caller_regs(regs);
___perf_sw_event(PERF_COUNT_SW_CPU_MIGRATIONS, 1, regs, 0);
task->sched_migrated = 0;
}
}
  • 4、“minor-faults”&“major-faults”的插桩点:

el0_sync() -> el0_da() -> do_mem_abort() -> do_mem_abort() -> do_page_fault():

1
2
3
4
5
6
7
8
9
10
11
12
13
14
15
16
17
18
19
20
21
22
23
24
25
26
27
28
29
static int __kprobes do_page_fault(unsigned long addr, unsigned int esr,
struct pt_regs *regs)
{

perf_sw_event(PERF_COUNT_SW_PAGE_FAULTS, 1, regs, addr);
if (mm_flags & FAULT_FLAG_ALLOW_RETRY) {
if (fault & VM_FAULT_MAJOR) {
tsk->maj_flt++;
/* “major-faults”的插桩点,被命中时上报数据 */
perf_sw_event(PERF_COUNT_SW_PAGE_FAULTS_MAJ, 1, regs,
addr);
} else {
tsk->min_flt++;
/* “minor-faults”的插桩点,被命中时上报数据 */
perf_sw_event(PERF_COUNT_SW_PAGE_FAULTS_MIN, 1, regs,
addr);
}
if (fault & VM_FAULT_RETRY) {
/*
* Clear FAULT_FLAG_ALLOW_RETRY to avoid any risk of
* starvation.
*/
mm_flags &= ~FAULT_FLAG_ALLOW_RETRY;
mm_flags |= FAULT_FLAG_TRIED;
goto retry;
}
}

}
  • 5、“alignment-faults”的插桩点:

arm64没有插桩点

  • 6、“emulation-faults”的插桩点:

cp15barrier_handler():

1
2
3
4
5
static int cp15barrier_handler(struct pt_regs *regs, u32 instr)
{
perf_sw_event(PERF_COUNT_SW_EMULATION_FAULTS, 1, regs, regs->pc);

}

1.2、采样法

采样法是间隔多少事件去采样,事件可以是指令数、时间、cache miss次数等。一般使用专门的硬件pmu来采样,“cpu-clock”、“task-clock”使用软件的hrtimer来采样。

在硬件PMU不支持的情况下,也可以参考hrtimer的采样值。

2、event init

2.1、”software”

1
2
3
4
5
6
7
8
9
10
11
12
13
14
static struct pmu perf_swevent = {
.task_ctx_nr = perf_sw_context,

.capabilities = PERF_PMU_CAP_NO_NMI,

.event_init = perf_swevent_init,
.add = perf_swevent_add,
.del = perf_swevent_del,
.start = perf_swevent_start,
.stop = perf_swevent_stop,
.read = perf_swevent_read,

.events_across_hotplug = 1,
};

对应初始化函数:

1
2
3
4
5
6
7
8
9
10
11
12
13
14
15
16
17
18
19
20
21
22
23
24
25
26
27
28
29
30
31
32
33
34
35
36
37
38
39
40
41
42
43
44
45
46
47
48
49
50
51
52
53
54
55
56
57
58
59
60
61
62
63
64
65
66
67
68
69
70
71
72
73
74
75
76
77
78
79
80
81
82
83
84
85
86
87
88
89
90
91
92
93
94
95
96
97
98
static int perf_swevent_init(struct perf_event *event)
{
u64 event_id = event->attr.config;

if (event->attr.type != PERF_TYPE_SOFTWARE)
return -ENOENT;

/*
* no branch sampling for software events
*/
if (has_branch_stack(event))
return -EOPNOTSUPP;

switch (event_id) {
case PERF_COUNT_SW_CPU_CLOCK:
case PERF_COUNT_SW_TASK_CLOCK:
return -ENOENT;

default:
break;
}

if (event_id >= PERF_COUNT_SW_MAX)
return -ENOENT;

if (!event->parent) {
int err;

/* (1) 确保per_cpu的hash表已经创建 */
err = swevent_hlist_get(event);
if (err)
return err;

/* (2) 打开event_id对应event的开关 */
static_key_slow_inc(&perf_swevent_enabled[event_id]);
event->destroy = sw_perf_event_destroy;
}

return 0;
}


static int swevent_hlist_get(struct perf_event *event)
{
int err;
int cpu, failed_cpu;

get_online_cpus();
for_each_possible_cpu(cpu) {
err = swevent_hlist_get_cpu(event, cpu);
if (err) {
failed_cpu = cpu;
goto fail;
}
}
put_online_cpus();

return 0;
fail:
for_each_possible_cpu(cpu) {
if (cpu == failed_cpu)
break;
swevent_hlist_put_cpu(event, cpu);
}

put_online_cpus();
return err;
}


static int swevent_hlist_get_cpu(struct perf_event *event, int cpu)
{
struct swevent_htable *swhash = &per_cpu(swevent_htable, cpu);
int err = 0;

mutex_lock(&swhash->hlist_mutex);

/* (1.1) 确保per_cpu的hash表已经分配 */
if (!swevent_hlist_deref(swhash) && cpu_online(cpu)) {
struct swevent_hlist *hlist;

hlist = kzalloc(sizeof(*hlist), GFP_KERNEL);
if (!hlist) {
err = -ENOMEM;
goto exit;
}
rcu_assign_pointer(swhash->swevent_hlist, hlist);
}

/* (1.2) 增加对hash表的引用 */
swhash->hlist_refcount++;
exit:
mutex_unlock(&swhash->hlist_mutex);

return err;
}

这里的核心是一个默认256大小的hash链表,稍后会根据(type+config)的hash键值把event链接进去。

1
2
3
4
5
6
7
#define SWEVENT_HLIST_BITS		8
#define SWEVENT_HLIST_SIZE (1 << SWEVENT_HLIST_BITS)

struct swevent_hlist {
struct hlist_head heads[SWEVENT_HLIST_SIZE];
struct rcu_head rcu_head;
};

2.2、“cpu-clock”

1
2
3
4
5
6
7
8
9
10
11
12
13
14
static struct pmu perf_cpu_clock = {
.task_ctx_nr = perf_sw_context,

.capabilities = PERF_PMU_CAP_NO_NMI,

.event_init = cpu_clock_event_init,
.add = cpu_clock_event_add,
.del = cpu_clock_event_del,
.start = cpu_clock_event_start,
.stop = cpu_clock_event_stop,
.read = cpu_clock_event_read,

.events_across_hotplug = 1,
};

对应初始化函数:

1
2
3
4
5
6
7
8
9
10
11
12
13
14
15
16
17
18
19
20
21
22
23
24
25
26
27
28
29
30
31
32
33
34
35
36
37
38
39
40
41
42
43
44
45
46
47
48
49
static int cpu_clock_event_init(struct perf_event *event)
{
if (event->attr.type != PERF_TYPE_SOFTWARE)
return -ENOENT;

if (event->attr.config != PERF_COUNT_SW_CPU_CLOCK)
return -ENOENT;

/*
* no branch sampling for software events
*/
if (has_branch_stack(event))
return -EOPNOTSUPP;

perf_swevent_init_hrtimer(event);

return 0;
}


static void perf_swevent_init_hrtimer(struct perf_event *event)
{
struct hw_perf_event *hwc = &event->hw;

if (!is_sampling_event(event))
return;

/* (1) 初始化对应hrtimer */
hrtimer_init(&hwc->hrtimer, CLOCK_MONOTONIC, HRTIMER_MODE_REL);
hwc->hrtimer.function = perf_swevent_hrtimer;

/*
* Since hrtimers have a fixed rate, we can do a static freq->period
* mapping and avoid the whole period adjust feedback stuff.
*/
/* (2) 如果是freq模式,根据freq计算period
在这种模式下->period_left不为负,等于->sample_period
*/
if (event->attr.freq) {
long freq = event->attr.sample_freq;

event->attr.sample_period = NSEC_PER_SEC / freq;
hwc->sample_period = event->attr.sample_period;
local64_set(&hwc->period_left, hwc->sample_period);
hwc->last_period = hwc->sample_period;
event->attr.freq = 0;
}
}

2.3、“task-clock”

1
2
3
4
5
6
7
8
9
10
11
12
13
14
static struct pmu perf_task_clock = {
.task_ctx_nr = perf_sw_context,

.capabilities = PERF_PMU_CAP_NO_NMI,

.event_init = task_clock_event_init,
.add = task_clock_event_add,
.del = task_clock_event_del,
.start = task_clock_event_start,
.stop = task_clock_event_stop,
.read = task_clock_event_read,

.events_across_hotplug = 1,
};

对应初始化函数:

1
2
3
4
5
6
7
8
9
10
11
12
13
14
15
16
17
18
static int task_clock_event_init(struct perf_event *event)
{
if (event->attr.type != PERF_TYPE_SOFTWARE)
return -ENOENT;

if (event->attr.config != PERF_COUNT_SW_TASK_CLOCK)
return -ENOENT;

/*
* no branch sampling for software events
*/
if (has_branch_stack(event))
return -EOPNOTSUPP;

perf_swevent_init_hrtimer(event);

return 0;
}

3、event add/del

在上一章“perf_event内核框架”中已经阐明,task维度的perf_event需要和task一起调度,其回调函数最后控制的就是perf_event的启动和停止。

  • start函数调用路径:context_switch() -> finish_task_switch() -> perf_event_task_sched_in() -> __perf_event_task_sched_in() -> perf_event_context_sched_in() -> perf_event_sched_in() -> ctx_sched_in() -> ctx_pinned_sched_in()/ctx_flexible_sched_in() -> group_sched_in() -> event_sched_in() -> pmu->add(event, PERF_EF_START) -> xxx_add():
  • stop函数调用路径:context_switch() -> prepare_task_switch() -> perf_event_task_sched_out() -> __perf_event_task_sched_out() -> perf_event_context_sched_out() -> ctx_sched_out() -> group_sched_out() -> event_sched_out() -> pmu->del() -> xxx_del():

3.1、”software”

perf_k_pmu_sw_provide_data

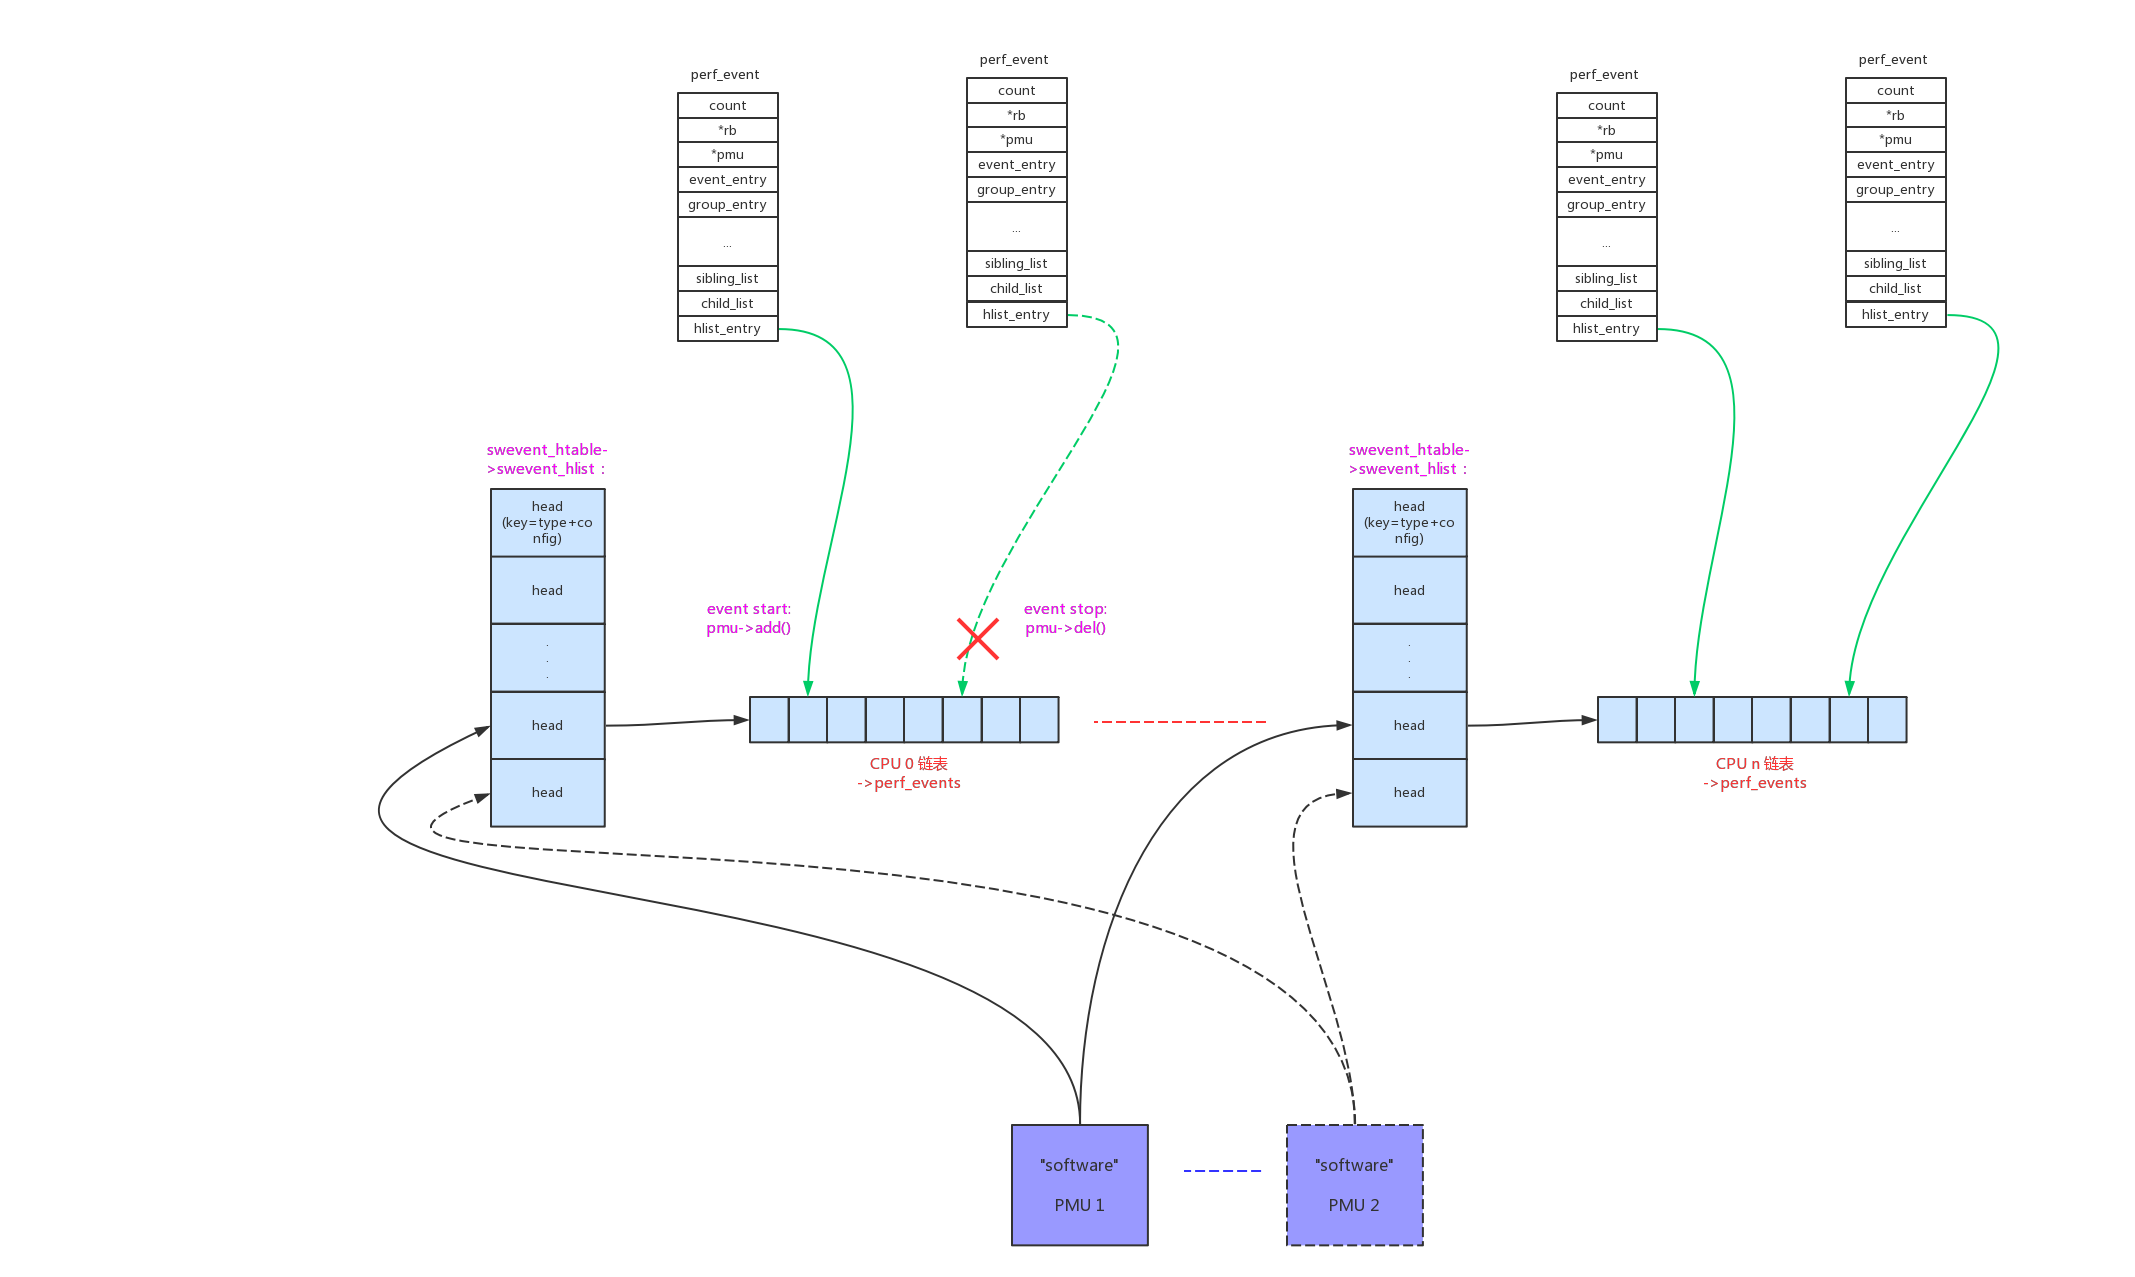
这种模式下,控制”software”event的启动和停止,实际上就是把event加入/移除到hash链表上。

  • perf_swevent_add():
1
2
3
4
5
6
7
8
9
10
11
12
13
14
15
16
17
18
19
20
21
22
23
24
25
static int perf_swevent_add(struct perf_event *event, int flags)
{
struct swevent_htable *swhash = this_cpu_ptr(&swevent_htable);
struct hw_perf_event *hwc = &event->hw;
struct hlist_head *head;

/* (1) 重新计算period参数 */
if (is_sampling_event(event)) {
hwc->last_period = hwc->sample_period;
perf_swevent_set_period(event);
}

hwc->state = !(flags & PERF_EF_START);

/* (2) 根据event的(type+config)计算在hash表中的链表head */
head = find_swevent_head(swhash, event);
if (WARN_ON_ONCE(!head))
return -EINVAL;

/* (3) 将event加入链表 */
hlist_add_head_rcu(&event->hlist_entry, head);
perf_event_update_userpage(event);

return 0;
}
  • perf_swevent_del():
1
2
3
4
5
static void perf_swevent_del(struct perf_event *event, int flags)
{
/* (1) 将event从链表中移除 */
hlist_del_rcu(&event->hlist_entry);
}

3.2、“cpu-clock”

每个event一个独立的hrtimer,所有就没有什么链表之类的了。

  • cpu_clock_event_add():
1
2
3
4
5
6
7
8
9
10
11
12
13
14
15
16
17
18
19
20
21
22
23
24
25
26
27
28
29
30
31
32
33
34
35
36
37
38
39
40
41
42
43
static int cpu_clock_event_add(struct perf_event *event, int flags)
{
if (flags & PERF_EF_START)
cpu_clock_event_start(event, flags);
perf_event_update_userpage(event);

return 0;
}


static void cpu_clock_event_start(struct perf_event *event, int flags)
{
/* (1) 记下当前的cpu time值 */
local64_set(&event->hw.prev_count, local_clock());

/* (2) 启动hrtimer */
perf_swevent_start_hrtimer(event);
}


static void perf_swevent_start_hrtimer(struct perf_event *event)
{
struct hw_perf_event *hwc = &event->hw;
s64 period;

if (!is_sampling_event(event))
return;

/* (2.1) hrtimer的周期为10ms和->sample_period两者中的较大值 */
period = local64_read(&hwc->period_left);
if (period) {
if (period < 0)
period = 10000;

local64_set(&hwc->period_left, 0);
} else {
period = max_t(u64, 10000, hwc->sample_period);
}
hrtimer_start(&hwc->hrtimer, ns_to_ktime(period),
HRTIMER_MODE_REL_PINNED);
}

hrtimer到期后的执行函数为perf_swevent_hrtimer(),它会定期的上报sample数据。

1
2
3
4
5
6
7
8
9
10
11
12
13
14
15
16
17
18
19
20
21
22
23
24
25
26
27
28
29
static enum hrtimer_restart perf_swevent_hrtimer(struct hrtimer *hrtimer)
{
enum hrtimer_restart ret = HRTIMER_RESTART;
struct perf_sample_data data;
struct pt_regs *regs;
struct perf_event *event;
u64 period;

event = container_of(hrtimer, struct perf_event, hw.hrtimer);

if (event->state != PERF_EVENT_STATE_ACTIVE)
return HRTIMER_NORESTART;

event->pmu->read(event);

perf_sample_data_init(&data, 0, event->hw.last_period);
regs = get_irq_regs();

if (regs && !perf_exclude_event(event, regs)) {
if (!(event->attr.exclude_idle && is_idle_task(current)))
if (__perf_event_overflow(event, 1, &data, regs))
ret = HRTIMER_NORESTART;
}

period = max_t(u64, 10000, event->hw.sample_period);
hrtimer_forward_now(hrtimer, ns_to_ktime(period));

return ret;
}
  • cpu_clock_event_del():
1
2
3
4
5
6
7
8
9
10
11
12
13
14
15
16
17
18
19
20
21
22
23
24
25
26
27
28
29
static void cpu_clock_event_del(struct perf_event *event, int flags)
{
cpu_clock_event_stop(event, flags);
}


static void cpu_clock_event_stop(struct perf_event *event, int flags)
{
/* (1) 停止hrtimer */
perf_swevent_cancel_hrtimer(event);

/* (2) 计算cpu time的差值,用来更新event的count值 */
cpu_clock_event_update(event);
}


static void cpu_clock_event_update(struct perf_event *event)
{
s64 prev;
u64 now;

now = local_clock();
prev = local64_xchg(&event->hw.prev_count, now);

/* (2.1) 使用差值来更新count值 */
local64_add(now - prev, &event->count);
}

3.3、“task-clock”

“task-clock”和“cpu-clock”基本一致,只是它计算的count值是event所在context time的差值。

  • task_clock_event_add():
1
2
3
4
5
6
7
8
9
10
11
12
13
14
15
16
static int task_clock_event_add(struct perf_event *event, int flags)
{
if (flags & PERF_EF_START)
task_clock_event_start(event, flags);
perf_event_update_userpage(event);

return 0;
}


static void task_clock_event_start(struct perf_event *event, int flags)
{
local64_set(&event->hw.prev_count, event->ctx->time);
perf_swevent_start_hrtimer(event);
}
  • task_clock_event_del():
1
2
3
4
5
6
7
8
9
10
11
12
13
14
15
16
17
18
19
20
21
22
23
24
static void task_clock_event_del(struct perf_event *event, int flags)
{
task_clock_event_stop(event, PERF_EF_UPDATE);
}


static void task_clock_event_stop(struct perf_event *event, int flags)
{
perf_swevent_cancel_hrtimer(event);
task_clock_event_update(event, event->ctx->time);
}


static void task_clock_event_update(struct perf_event *event, u64 now)
{
u64 prev;
s64 delta;

prev = local64_xchg(&event->hw.prev_count, now);
delta = now - prev;
local64_add(delta, &event->count);
}

4、event 数据采集

4.1、”software”

在插桩点被触发后,累加count数据,并且上报sample数据。以“context-switches”为例:

context_switch() -> prepare_task_switch() -> perf_event_task_sched_out():

1
2
3
4
5
6
7
8
9
10
11
12
13
14
15
16
17
18
19
20
21
22
23
24
25
26
27
28
29
30
31
32
33
34
35
36
37
38
39
40
41
42
43
44
45
46
47
48
49
50
51
52
53
54
55
56
57
58
59
60
61
62
63
64
65
66
67
68
69
70
71
72
73
74
75
76
77
78
79
80
81
82
83
84
85
86
87
88
89
90
91
92
93
94
95
96
97
98
static inline void perf_event_task_sched_out(struct task_struct *prev,
struct task_struct *next)
{
/* (1) “context-switches”的插桩点,被命中时上报数据 */
perf_sw_event_sched(PERF_COUNT_SW_CONTEXT_SWITCHES, 1, 0);

if (static_key_false(&perf_sched_events.key))
__perf_event_task_sched_out(prev, next);
}


static __always_inline void
perf_sw_event_sched(u32 event_id, u64 nr, u64 addr)
{
/* (1.1) event开关在init时被使能 */
if (static_key_false(&perf_swevent_enabled[event_id])) {
struct pt_regs *regs = this_cpu_ptr(&__perf_regs[0]);

perf_fetch_caller_regs(regs);
___perf_sw_event(event_id, nr, regs, addr);
}
}


void ___perf_sw_event(u32 event_id, u64 nr, struct pt_regs *regs, u64 addr)
{
struct perf_sample_data data;

if (WARN_ON_ONCE(!regs))
return;

perf_sample_data_init(&data, addr, 0);
do_perf_sw_event(PERF_TYPE_SOFTWARE, event_id, nr, &data, regs);
}


static void do_perf_sw_event(enum perf_type_id type, u32 event_id,
u64 nr,
struct perf_sample_data *data,
struct pt_regs *regs)
{
struct swevent_htable *swhash = this_cpu_ptr(&swevent_htable);
struct perf_event *event;
struct hlist_head *head;

rcu_read_lock();

/* (1.1.1) 找出pmu在hash表中的event链表 */
head = find_swevent_head_rcu(swhash, type, event_id);
if (!head)
goto end;

/* (1.1.2) 逐个向event发送数据 */
hlist_for_each_entry_rcu(event, head, hlist_entry) {

/* (1.1.3) 因为key(type+config)在hash中可能重复,再进行精确判断 */
if (perf_swevent_match(event, type, event_id, data, regs))
perf_swevent_event(event, nr, data, regs);
}
end:
rcu_read_unlock();
}


static void perf_swevent_event(struct perf_event *event, u64 nr,
struct perf_sample_data *data,
struct pt_regs *regs)
{
struct hw_perf_event *hwc = &event->hw;

/* (1.1.2.1) 更新count数据 */
local64_add(nr, &event->count);

if (!regs)
return;

if (!is_sampling_event(event))
return;

/* (1.1.2.2) 上报采样数据,具体可以参考"tracepoint events"一章 */
if ((event->attr.sample_type & PERF_SAMPLE_PERIOD) && !event->attr.freq) {
data->period = nr;
return perf_swevent_overflow(event, 1, data, regs);
} else
data->period = event->hw.last_period;

if (nr == 1 && hwc->sample_period == 1 && !event->attr.freq)
return perf_swevent_overflow(event, 1, data, regs);

if (local64_add_negative(nr, &hwc->period_left))
return;

perf_swevent_overflow(event, 0, data, regs);
}

4.2、“cpu-clock”

  • 在del()操作时,计算count差值:

cpu_clock_event_del() -> cpu_clock_event_stop() -> cpu_clock_event_update():

1
2
3
4
5
6
7
8
9
10
11
static void cpu_clock_event_update(struct perf_event *event)
{
s64 prev;
u64 now;

now = local_clock();
prev = local64_xchg(&event->hw.prev_count, now);

/* 增加count值 */
local64_add(now - prev, &event->count);
}
  • 在hrtimer中,定时上报sample数据:
1
2
3
4
5
6
7
8
9
10
11
12
13
14
15
16
17
18
19
20
21
22
23
24
25
26
27
28
29
30
31
static enum hrtimer_restart perf_swevent_hrtimer(struct hrtimer *hrtimer)
{
enum hrtimer_restart ret = HRTIMER_RESTART;
struct perf_sample_data data;
struct pt_regs *regs;
struct perf_event *event;
u64 period;

event = container_of(hrtimer, struct perf_event, hw.hrtimer);

if (event->state != PERF_EVENT_STATE_ACTIVE)
return HRTIMER_NORESTART;

event->pmu->read(event);

perf_sample_data_init(&data, 0, event->hw.last_period);
regs = get_irq_regs();

if (regs && !perf_exclude_event(event, regs)) {
if (!(event->attr.exclude_idle && is_idle_task(current)))

/* 上报sample值 */
if (__perf_event_overflow(event, 1, &data, regs))
ret = HRTIMER_NORESTART;
}

period = max_t(u64, 10000, event->hw.sample_period);
hrtimer_forward_now(hrtimer, ns_to_ktime(period));

return ret;
}

4.3、“task-clock”

在del()操作时,计算count差值:

task_clock_event_del() -> task_clock_event_stop() -> task_clock_event_update():

1
2
3
4
5
6
7
8
9
10
11
static void task_clock_event_update(struct perf_event *event, u64 now)
{
u64 prev;
s64 delta;

prev = local64_xchg(&event->hw.prev_count, now);
delta = now - prev;

/* 增加count值 */
local64_add(delta, &event->count);
}

在hrtimer中,定时上报sample数据:

1
2
3
4
5
6
7
8
9
10
11
12
13
14
15
16
17
18
19
20
21
22
23
24
25
26
27
28
29
30
31
static enum hrtimer_restart perf_swevent_hrtimer(struct hrtimer *hrtimer)
{
enum hrtimer_restart ret = HRTIMER_RESTART;
struct perf_sample_data data;
struct pt_regs *regs;
struct perf_event *event;
u64 period;

event = container_of(hrtimer, struct perf_event, hw.hrtimer);

if (event->state != PERF_EVENT_STATE_ACTIVE)
return HRTIMER_NORESTART;

event->pmu->read(event);

perf_sample_data_init(&data, 0, event->hw.last_period);
regs = get_irq_regs();

if (regs && !perf_exclude_event(event, regs)) {
if (!(event->attr.exclude_idle && is_idle_task(current)))

/* 上报sample值 */
if (__perf_event_overflow(event, 1, &data, regs))
ret = HRTIMER_NORESTART;
}

period = max_t(u64, 10000, event->hw.sample_period);
hrtimer_forward_now(hrtimer, ns_to_ktime(period));

return ret;
}