Linux Perf 1.2、tracepoint events

perf复用了ftrace中trace_event的所有插桩点(即tracepoint),trace数据即可以通过ftrace的通道提供,也可以被包装成perf_event供perf工具使用。

可以通过perf list命令来查看系统中的tracpoint event,可以看到和/sys/kernel/debug/tracing/events/路径下的trace_event一致:

1
2
3
4
5
6
7
8
9
10
11
12
13
14
# simpleperf list tracepoint | more
List of tracepoint events:
almk:almk_shrink
almk:almk_vmpressure
asoc:snd_soc_bias_level_done
asoc:snd_soc_bias_level_start
asoc:snd_soc_dapm_connected
asoc:snd_soc_dapm_done
asoc:snd_soc_dapm_path
asoc:snd_soc_dapm_start
asoc:snd_soc_dapm_walk_done
asoc:snd_soc_dapm_widget_event_done
asoc:snd_soc_dapm_widget_event_start
asoc:snd_soc_dapm_widget_power

1、原理介绍:

trace_event在定义的时候,已经把trace_point、trace_event的callback函数、perf_event的callback函数全都给定义好了。只需要使用现成的架构把perf_event的callback函数给注册到trace_point上去就行了。

include/trace/trace_event.h:

1
2
3
4
5
6
7
8
9
10
11
12
13
14
15
16
17
18
19
20
21
22
23
24
25
26
27
28
29
30
31
32
33
34
35
36
37
38
39
40
/* (1) trace_event_class的定义 */
#undef DECLARE_EVENT_CLASS
#define DECLARE_EVENT_CLASS(call, proto, args, tstruct, assign, print) \
_TRACE_PERF_PROTO(call, PARAMS(proto)); \
static char print_fmt_##call[] = print; \
static struct trace_event_class __used __refdata event_class_##call = { \
.system = TRACE_SYSTEM_STRING, \
.define_fields = trace_event_define_fields_##call, \
.fields = LIST_HEAD_INIT(event_class_##call.fields),\
.raw_init = trace_event_raw_init, \

/* (1.1) trace_event的回调函数 */
.probe = trace_event_raw_event_##call, \

/* (1.2) 注册函数,把callback函数加入到tracepoint中 */
.reg = trace_event_reg, \

/* (1.3) perf_event部分的定义 */
_TRACE_PERF_INIT(call) \
};

/* (2) trace_event_call的定义 */
#undef DEFINE_EVENT
#define DEFINE_EVENT(template, call, proto, args) \
\
static struct trace_event_call __used event_##call = { \

/* (2.1) 对trace_event_class的引用 */
.class = &event_class_##template, \

/* (2.2) tracepoint的定义 */
{ \
.tp = &__tracepoint_##call, \
}, \
.event.funcs = &trace_event_type_funcs_##template, \
.print_fmt = print_fmt_##template, \
.flags = TRACE_EVENT_FL_TRACEPOINT, \
}; \
static struct trace_event_call __used \
__attribute__((section("_ftrace_events"))) *__event_##call = &event_##call

_TRACE_PERF_INIT()宏的展开:

1
2
3
4
5
6
7
8
9
10
11
12
13
14
15
#ifdef CONFIG_PERF_EVENTS

#define _TRACE_PERF_PROTO(call, proto) \
static notrace void \
perf_trace_##call(void *__data, proto);

#define _TRACE_PERF_INIT(call) \

/* (1.3) perf_event的回调函数:perf_trace_##call() */
.perf_probe = perf_trace_##call,

#else
#define _TRACE_PERF_PROTO(call, proto)
#define _TRACE_PERF_INIT(call)
#endif /* CONFIG_PERF_EVENTS */

继续追踪perf_event的回调函数,include/trace/perf.h:

1
2
3
4
5
6
7
8
9
10
11
12
13
14
15
16
17
18
19
20
21
22
23
24
25
26
27
28
29
30
31
32
33
34
35
36
37
38
39
40
41
42
43
44
45
46
47
48
49
50
51
52
#undef DECLARE_EVENT_CLASS
#define DECLARE_EVENT_CLASS(call, proto, args, tstruct, assign, print) \
static notrace void \
perf_trace_##call(void *__data, proto) \
{ \
struct trace_event_call *event_call = __data; \
struct trace_event_data_offsets_##call __maybe_unused __data_offsets;\
struct trace_event_raw_##call *entry; \
struct pt_regs *__regs; \
u64 __addr = 0, __count = 1; \
struct task_struct *__task = NULL; \
struct hlist_head *head; \
int __entry_size; \
int __data_size; \
int rctx; \
\
__data_size = trace_event_get_offsets_##call(&__data_offsets, args); \
\
head = this_cpu_ptr(event_call->perf_events); \
if (__builtin_constant_p(!__task) && !__task && \
hlist_empty(head)) \
return; \
\
/* (1) 计算需要存储的trace数据的长度 */
__entry_size = ALIGN(__data_size + sizeof(*entry) + sizeof(u32),\
sizeof(u64)); \
__entry_size -= sizeof(u32); \
\

/* (2) 分配存储数据的tmp buffer */
entry = perf_trace_buf_prepare(__entry_size, \
event_call->event.type, &__regs, &rctx); \
if (!entry) \
return; \
\

/* (3) get当前register */
perf_fetch_caller_regs(__regs); \
\

/* (4) 给动态成员的占位符赋值:offset + size */
tstruct \
\

/* (5) 记录trace数据到tmp buffer中 */
{ assign; } \
\

/* (6) 提交trace数据给连接到本tracepoint上的所有perf_event,拷贝tmp buffer到perf_event的ringbuffer中 */
perf_trace_buf_submit(entry, __entry_size, rctx, __addr, \
__count, __regs, head, __task); \
}

我们接下来看一下详细的过程和数据格式。

2、event init

tracepoint pmu的定义如下:

1
2
3
4
5
6
7
8
9
10
11
12
static struct pmu perf_tracepoint = {
.task_ctx_nr = perf_sw_context,

.event_init = perf_tp_event_init,
.add = perf_trace_add,
.del = perf_trace_del,
.start = perf_swevent_start,
.stop = perf_swevent_stop,
.read = perf_swevent_read,

.events_across_hotplug = 1,
};

在调用perf_event_open()系统调用创建新的perf_event的时候,会调用到pmu->event_init()函数。

perf_event_open() -> perf_event_alloc() -> perf_init_event() -> perf_try_init_event() -> pmu->event_init(event) -> perf_tp_event_init():

1
2
3
4
5
6
7
8
9
10
11
12
13
14
15
16
17
18
19
20
21
22
23
24
25
26
27
28
29
30
31
32
33
34
35
36
37
38
39
40
41
42
43
44
45
46
47
48
49
50
51
52
53
54
55
56
57
58
59
60
61
62
63
64
65
66
67
68
69
70
71
72
73
74
75
76
77
78
79
80
81
82
83
84
85
86
87
88
89
90
91
92
93
94
95
96
97
98
99
100
101
102
103
104
105
106
107
108
109
110
111
112
113
114
115
116
117
118
119
120
121
122
123
124
125
126
127
128
129
130
131
132
133
134
135
136
137
138
139
140
141
142
143
144
145
146
static int perf_tp_event_init(struct perf_event *event)
{
int err;

/* (1) attr.type类型不对,出错返回 */
if (event->attr.type != PERF_TYPE_TRACEPOINT)
return -ENOENT;

/*
* no branch sampling for tracepoint events
*/
/* (2) tracepoint sample数据中不支持分支采样 */
if (has_branch_stack(event))
return -EOPNOTSUPP;

/* (3) 继续init */
err = perf_trace_init(event);
if (err)
return err;

event->destroy = tp_perf_event_destroy;

return 0;
}


int perf_trace_init(struct perf_event *p_event)
{
struct trace_event_call *tp_event;
u64 event_id = p_event->attr.config;
int ret = -EINVAL;

mutex_lock(&event_mutex);

/* (3.1) 遍历trace_event_call链表,找到type等于attr.config的trace_event_call */
list_for_each_entry(tp_event, &ftrace_events, list) {
if (tp_event->event.type == event_id &&
tp_event->class && tp_event->class->reg &&
try_module_get(tp_event->mod)) {

/* (3.2) 继续初始化 */
ret = perf_trace_event_init(tp_event, p_event);
if (ret)
module_put(tp_event->mod);
break;
}
}
mutex_unlock(&event_mutex);

return ret;
}


static int perf_trace_event_init(struct trace_event_call *tp_event,
struct perf_event *p_event)
{
int ret;

/* (3.2.1) 权限判断 */
ret = perf_trace_event_perm(tp_event, p_event);
if (ret)
return ret;

/* (3.2.2) register操作 */
ret = perf_trace_event_reg(tp_event, p_event);
if (ret)
return ret;

/* (3.2.3) open操作,对tracepoint来说这部分为空 */
ret = perf_trace_event_open(p_event);
if (ret) {
perf_trace_event_unreg(p_event);
return ret;
}

return 0;
}


static int perf_trace_event_reg(struct trace_event_call *tp_event,
struct perf_event *p_event)
{
struct hlist_head __percpu *list;
int ret = -ENOMEM;
int cpu;

p_event->tp_event = tp_event;
if (tp_event->perf_refcount++ > 0)
return 0;

list = alloc_percpu(struct hlist_head);
if (!list)
goto fail;

/* (3.2.2.1) 初始化trace_event_call上per_cpu的perf_event挂载链表:tp_event->perf_events
如果perf_event需要接收tracepoint的数据,需要按绑定的cpu挂载到对应的per_cpu链表上
*/
for_each_possible_cpu(cpu)
INIT_HLIST_HEAD(per_cpu_ptr(list, cpu));

tp_event->perf_events = list;

/* (3.2.2.2) 分配tmp buffer空间,buffer都是per_cpu的每个cpu上都有
context包括4种:task, softirq, hardirq, nmi.
*/
if (!total_ref_count) {
char __percpu *buf;
int i;

for (i = 0; i < PERF_NR_CONTEXTS; i++) {
buf = (char __percpu *)alloc_percpu(perf_trace_t);
if (!buf)
goto fail;

perf_trace_buf[i] = buf;
}
}

/* (3.2.2.3) 调用class->reg(TRACE_REG_PERF_REGISTER)注册 */
ret = tp_event->class->reg(tp_event, TRACE_REG_PERF_REGISTER, NULL);
if (ret)
goto fail;

total_ref_count++;
return 0;

fail:
if (!total_ref_count) {
int i;

for (i = 0; i < PERF_NR_CONTEXTS; i++) {
free_percpu(perf_trace_buf[i]);
perf_trace_buf[i] = NULL;
}
}

if (!--tp_event->perf_refcount) {
free_percpu(tp_event->perf_events);
tp_event->perf_events = NULL;
}

return ret;
}

tp_event->class->reg()函数在trace_event_class定义时,已经确定为trace_event_reg()函数:

1
2
3
4
5
6
7
8
9
10
11
12
13
14
15
16
17
18
19
20
21
22
23
24
25
26
27
28
29
30
31
32
33
34
35
36
37
38
39
40
int trace_event_reg(struct trace_event_call *call,
enum trace_reg type, void *data)
{
struct trace_event_file *file = data;

WARN_ON(!(call->flags & TRACE_EVENT_FL_TRACEPOINT));
switch (type) {

/* (1) 把trace_event的callback函数注册到tracepoint上 */
case TRACE_REG_REGISTER:
return tracepoint_probe_register(call->tp,
call->class->probe,
file);
case TRACE_REG_UNREGISTER:
tracepoint_probe_unregister(call->tp,
call->class->probe,
file);
return 0;

#ifdef CONFIG_PERF_EVENTS

/* (2) 把perf_event的callback函数注册到tracepoint上 */
case TRACE_REG_PERF_REGISTER:
return tracepoint_probe_register(call->tp,
call->class->perf_probe,
call);
case TRACE_REG_PERF_UNREGISTER:
tracepoint_probe_unregister(call->tp,
call->class->perf_probe,
call);
return 0;
case TRACE_REG_PERF_OPEN:
case TRACE_REG_PERF_CLOSE:
case TRACE_REG_PERF_ADD:
case TRACE_REG_PERF_DEL:
return 0;
#endif
}
return 0;
}

经过上述初始化注册以后,perf_event的callback函数已经插入到tracepoint中。此时如果tracepoint被命中,perf_event的callback函数会被调用,但是trace数据无人接收,因为tp_event->perf_events链表中还没有接收的perf_event。

3、event add/del

perf_k_pmu_tp_provide_data

承接上一步perf_event注册以后,perf_event的回调函数已经可以被tracepoint调用,但是perf_event仍然收不到数据。因为这个时候perf_event还处于enable/inactive状态,需要处于active状态才能收到数据。

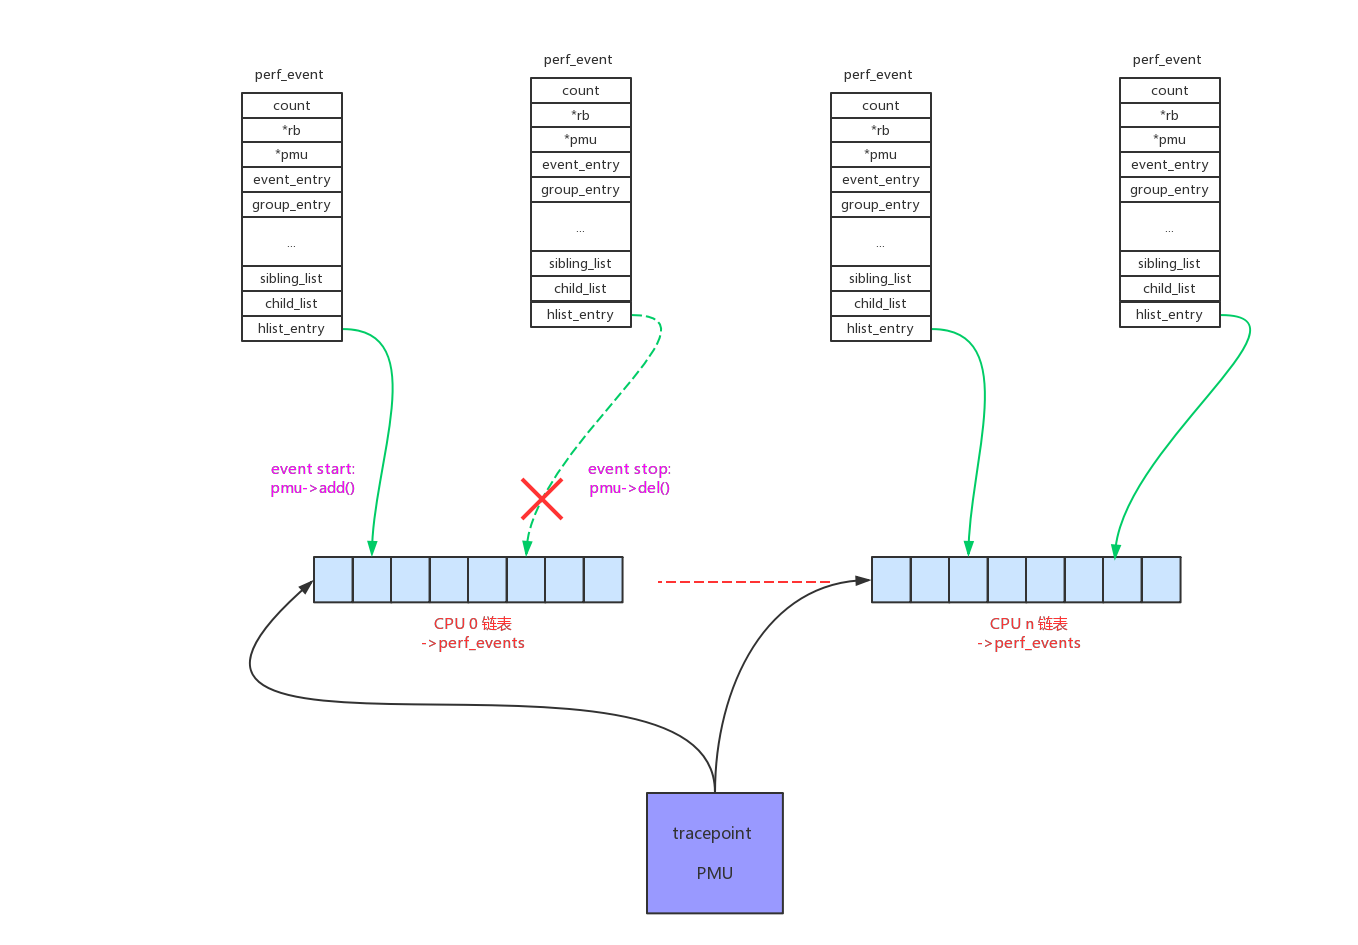
一个tracepoint会给多个perf_event提供数据,只有将perf_event加入到tp_event->perf_events per_cpu链表中才能收到数据。所以对tracepoint perf_event的start/stop就是操作tp_event->perf_events per_cpu链表。

在上一章“perf_event内核框架”中已经阐明,task维度的perf_event需要和task一起调度,其回调函数最后控制的就是perf_event的启动和停止。

context_switch() -> finish_task_switch() -> perf_event_task_sched_in() -> __perf_event_task_sched_in() -> perf_event_context_sched_in() -> perf_event_sched_in() -> ctx_sched_in() -> ctx_pinned_sched_in()/ctx_flexible_sched_in() -> group_sched_in() -> event_sched_in() -> pmu->add(event, PERF_EF_START) -> perf_trace_add():

1
2
3
4
5
6
7
8
9
10
11
12
13
14
15
16
17
18
19
20
int perf_trace_add(struct perf_event *p_event, int flags)
{
struct trace_event_call *tp_event = p_event->tp_event;
struct hlist_head __percpu *pcpu_list;
struct hlist_head *list;

pcpu_list = tp_event->perf_events;
if (WARN_ON_ONCE(!pcpu_list))
return -EINVAL;

if (!(flags & PERF_EF_START))
p_event->hw.state = PERF_HES_STOPPED;

/* (1) 将perf_event加入到tp_event->perf_events的当前cpu链表中 */
list = this_cpu_ptr(pcpu_list);
hlist_add_head_rcu(&p_event->hlist_entry, list);

/* (2) 空操作 */
return tp_event->class->reg(tp_event, TRACE_REG_PERF_ADD, p_event);
}

context_switch() -> prepare_task_switch() -> perf_event_task_sched_out() -> __perf_event_task_sched_out() -> perf_event_context_sched_out() -> ctx_sched_out() -> group_sched_out() -> event_sched_out() -> pmu->del() -> perf_trace_del():

1
2
3
4
5
6
7
8
9
10
11
void perf_trace_del(struct perf_event *p_event, int flags)
{
struct trace_event_call *tp_event = p_event->tp_event;

/* (1) 将perf_event从tp_event->perf_events的链表中删除 */
if (!hlist_unhashed(&p_event->hlist_entry))
hlist_del_rcu(&p_event->hlist_entry);

/* (2) 空操作 */
tp_event->class->reg(tp_event, TRACE_REG_PERF_DEL, p_event);
}

4、event 数据采集

perf_event的主要功能就是提供count类型或者sample类型的trace数据。

tracepoint pmu提供trace数据的方式是被动的:tracepoint被命中后,perf callback函数被调用后,累加perf_event的count值,如果perf_event分配了ringbuffer记录sample数据。

4.1、count数据

我们在定义用户trace_event时使用__perf_count()宏指定每次tracepoint命中count的累加值。例如:

1
2
3
4
5
6
7
8
9
10
11
12
13
14
15
16
17
18
19
20
21
22
23
24
25
26
DECLARE_EVENT_CLASS(sched_stat_runtime,

TP_PROTO(struct task_struct *tsk, u64 runtime, u64 vruntime),

/* (1) 指定每次命中,count累加runtime */
TP_ARGS(tsk, __perf_count(runtime), vruntime),

TP_STRUCT__entry(
__array( char, comm, TASK_COMM_LEN )
__field( pid_t, pid )
__field( u64, runtime )
__field( u64, vruntime )
),

TP_fast_assign(
memcpy(__entry->comm, tsk->comm, TASK_COMM_LEN);
__entry->pid = tsk->pid;
__entry->runtime = runtime;
__entry->vruntime = vruntime;
),

TP_printk("comm=%s pid=%d runtime=%Lu [ns] vruntime=%Lu [ns]",
__entry->comm, __entry->pid,
(unsigned long long)__entry->runtime,
(unsigned long long)__entry->vruntime)
);

如果没有使用__perf_count()宏定义,默认每次tracepoint命中count加1。

看看具体的代码:

1
2
3
4
5
6
7
8
9
10
11
12
13
14
15
16
17
18
19
20
21
22
23
24
25
26
27
28
29
30
31
32
33
34
35
36
37
38
39
40
41
42
43
44
45
46
47
48
49
50
51
52
53
54
55
56
57
58
59
60
61
62
63
64
65
66
67
68
69
70
71
72
73
74
75
76
/* (1.1) __perf_addr()宏,指定sample时PERF_SAMPLE_ADDR的值 */
#undef __perf_addr
#define __perf_addr(a) (__addr = (a))

/* (1.2) __perf_count()宏,指定count的累加值 */
#undef __perf_count
#define __perf_count(c) (__count = (c))

/* (1.3) __perf_task()宏,指定由某个task上绑定的perf_event来接收trace数据 */
#undef __perf_task
#define __perf_task(t) (__task = (t))

#undef DECLARE_EVENT_CLASS
#define DECLARE_EVENT_CLASS(call, proto, args, tstruct, assign, print) \
static notrace void \
perf_trace_##call(void *__data, proto) \
{ \
struct trace_event_call *event_call = __data; \
struct trace_event_data_offsets_##call __maybe_unused __data_offsets;\
struct trace_event_raw_##call *entry; \
struct pt_regs *__regs; \

/* (1.4) 如果没有使用宏指定,默认值:
__addr = 0
__count = 1
__task = NULL
*/
u64 __addr = 0, __count = 1; \
struct task_struct *__task = NULL; \
struct hlist_head *head; \
int __entry_size; \
int __data_size; \
int rctx; \
\
/* (2.1) 获取动态成员的长度 */
__data_size = trace_event_get_offsets_##call(&__data_offsets, args); \
\
/* (3) 获取tracepoint的本cpu perf_event链表,需要本cpu tracepoint数据的perf_event都链接于此 */
head = this_cpu_ptr(event_call->perf_events); \
if (__builtin_constant_p(!__task) && !__task && \
hlist_empty(head)) \
return; \
\

/* (2.2) 计算需要存储的raw data的总长度:动态长度 + 固定成员长度 */
__entry_size = ALIGN(__data_size + sizeof(*entry) + sizeof(u32),\
sizeof(u64)); \
__entry_size -= sizeof(u32); \
\
/* (4) 根据长度获得tmp buffer
并得到当前的context:task, softirq, hardirq, nmi.
*/
entry = perf_trace_buf_prepare(__entry_size, \
event_call->event.type, &__regs, &rctx); \
if (!entry) \
return; \
\

/* (5) get当前register */
perf_fetch_caller_regs(__regs); \
\

/* (6) 给动态成员的占位符赋值:offset + size */
tstruct \
\

/* (7) 记录trace数据到tmp buffer中 */
{ assign; } \
\

/* (6) 提交raw data数据给连接到本tracepoint上的所有perf_event,拷贝tmp buffer到perf_event的ringbuffer中
注意:这里的数据只是raw data数据,整个perf的sample数据还包括其他一些数据
*/
perf_trace_buf_submit(entry, __entry_size, rctx, __addr, \
__count, __regs, head, __task); \
}

perf_trace_buf_prepare()函数的作用是获取一块tmp buffer,为了避免互斥根据当前的context(task, softirq, hardirq, nmi)和当前cpu,从per_cpu变量中分配到一块对应的buffer:

1
2
3
4
5
6
7
8
9
10
11
12
13
14
15
16
17
18
19
20
21
22
23
24
25
26
27
28
29
30
31
32
33
34
35
36
37
38
39
40
41
42
43
44
45
46
47
48
49
50
51
52
53
54
55
56
57
58
59
60
61
62
63
64
65
66
67
68
69
70
71
72
73
void *perf_trace_buf_prepare(int size, unsigned short type,
struct pt_regs **regs, int *rctxp)
{
struct trace_entry *entry;
unsigned long flags;
char *raw_data;
int pc;

BUILD_BUG_ON(PERF_MAX_TRACE_SIZE % sizeof(unsigned long));

if (WARN_ONCE(size > PERF_MAX_TRACE_SIZE,
"perf buffer not large enough"))
return NULL;

pc = preempt_count();

/* (4.1) 获取当前的context,并且防止递归进入 */
*rctxp = perf_swevent_get_recursion_context();
if (*rctxp < 0)
return NULL;

/* (4.2) 根据context。获取到保存reg的tmp buffer */
if (regs)
*regs = this_cpu_ptr(&__perf_regs[*rctxp]);

/* (4.3) 根据context。获取到保存trace data的tmp buffer */
raw_data = this_cpu_ptr(perf_trace_buf[*rctxp]);

/* zero the dead bytes from align to not leak stack to user */
memset(&raw_data[size - sizeof(u64)], 0, sizeof(u64));

entry = (struct trace_entry *)raw_data;
local_save_flags(flags);

/* (4.4) 给tmp trace data buffer中的comm字段赋值 */
tracing_generic_entry_update(entry, flags, pc);
entry->type = type;

return raw_data;
}


int perf_swevent_get_recursion_context(void)
{
struct swevent_htable *swhash = this_cpu_ptr(&swevent_htable);

return get_recursion_context(swhash->recursion);
}


static inline int get_recursion_context(int *recursion)
{
int rctx;

if (in_nmi())
rctx = 3;
else if (in_irq())
rctx = 2;
else if (in_softirq())
rctx = 1;
else
rctx = 0;

if (recursion[rctx])
return -1;

recursion[rctx]++;
barrier();

return rctx;
}

perf_trace_buf_submit()负责提交数据给this_cpu_ptr(event_call->perf_events)链表上等待的perf_event:

1
2
3
4
5
6
7
8
9
10
11
12
13
14
15
16
17
18
19
20
21
22
23
24
25
26
27
28
29
30
31
32
33
34
35
36
37
38
39
40
41
42
43
44
45
46
47
48
49
50
51
52
53
54
55
56
57
58
59
60
61
62
63
64
65
66
67
68
69
70
71
72
73
74
75
76
77
78
79
80
81
82
83
84
85
86
87
88
89
90
91
92
93
94
95
96
static inline void
perf_trace_buf_submit(void *raw_data, int size, int rctx, u64 addr,
u64 count, struct pt_regs *regs, void *head,
struct task_struct *task)
{
perf_tp_event(addr, count, raw_data, size, regs, head, rctx, task);
}


void perf_tp_event(u64 addr, u64 count, void *record, int entry_size,
struct pt_regs *regs, struct hlist_head *head, int rctx,
struct task_struct *task)
{
struct perf_sample_data data;
struct perf_event *event;

/* (6.1) 存放raw data */
struct perf_raw_record raw = {
.size = entry_size,
.data = record,
};

/* (6.2) 初始化sample data */
perf_sample_data_init(&data, addr, 0);
data.raw = &raw;

/* (6.3) 把sample数据逐个发送给this_cpu_ptr(event_call->perf_events)链表上链接的perf_event */
hlist_for_each_entry_rcu(event, head, hlist_entry) {
if (perf_tp_event_match(event, &data, regs))
perf_swevent_event(event, count, &data, regs);
}

/*
* If we got specified a target task, also iterate its context and
* deliver this event there too.
*/
/* (6.4) __perf_task()宏,指定由某个task上绑定的perf_event来接收sample数据 */
if (task && task != current) {
struct perf_event_context *ctx;
struct trace_entry *entry = record;

rcu_read_lock();
ctx = rcu_dereference(task->perf_event_ctxp[perf_sw_context]);
if (!ctx)
goto unlock;

list_for_each_entry_rcu(event, &ctx->event_list, event_entry) {
if (event->attr.type != PERF_TYPE_TRACEPOINT)
continue;
if (event->attr.config != entry->type)
continue;
if (perf_tp_event_match(event, &data, regs))
perf_swevent_event(event, count, &data, regs);
}
unlock:
rcu_read_unlock();
}

perf_swevent_put_recursion_context(rctx);
}


static void perf_swevent_event(struct perf_event *event, u64 nr,
struct perf_sample_data *data,
struct pt_regs *regs)
{
struct hw_perf_event *hwc = &event->hw;

/* (6.3.1) 重点:
perf_event的count值在这里累加
*/
local64_add(nr, &event->count);

if (!regs)
return;

/* (6.3.2) 没有指定sample方式的perf_event,不需要sample数据,直接返回 */
if (!is_sampling_event(event))
return;

if ((event->attr.sample_type & PERF_SAMPLE_PERIOD) && !event->attr.freq) {
data->period = nr;
return perf_swevent_overflow(event, 1, data, regs);
} else
data->period = event->hw.last_period;

if (nr == 1 && hwc->sample_period == 1 && !event->attr.freq)
return perf_swevent_overflow(event, 1, data, regs);

if (local64_add_negative(nr, &hwc->period_left))
return;

perf_swevent_overflow(event, 0, data, regs);
}

4.2、sample数据

我们来继续分析sample类型数据的上报。有两种上报方式:period、freq。

  • period上报方式:以每period间隔的方式上报。有3个相关的参数:

    event->hw.last_period // 当前的period值
    event->hw.period_left // 到period一个周期还剩多久,这是一个负值,取值范围(-last_period, 0)
    event->hw.sample_period // 最新的period值,只有当上一周期执行完后,才能更新:last_period = sample_period

1
2
3
4
5
6
7
8
9
10
11
12
13
14
15
16
17
18
19
20
21
22
23
24
25
26
27
28
29
30
31
32
33
34
35
36
37
38
39
40
41
42
43
44
45
46
47
48
49
50
51
52
53
54
55
56
57
58
59
60
61
62
63
64
65
66
67
68
69
70
71
72
73
74
75
76
77
78
79
80
81
82
83
84
85
86
87
88
89
90
91
92
93
94
95
96
97
98
99
100
101
102
103
104
105
106
107
108
109
110
111
112
113
114
115
116
117
118
119
120
121
122
123
124
125
126
127
128
129
130
131
132
133
134
135
136
137
138
139
140
141
142
143
144
145
146
147
148
149
150
151
152
static void perf_swevent_event(struct perf_event *event, u64 nr,
struct perf_sample_data *data,
struct pt_regs *regs)
{
struct hw_perf_event *hwc = &event->hw;

/* (1) 重点:
perf_event的count值在这里累加
*/
local64_add(nr, &event->count);

if (!regs)
return;

/* (2) 没有指定sample方式的perf_event,不需要sample数据,直接返回 */
if (!is_sampling_event(event))
return;

/* (3.1) 如果指定PERF_SAMPLE_PERIOD,且是period模式
不理period的限定,上报sample数据和当前data->period数据
perf_swevent_overflow()的overflow参数 = 1,说明不理period的时间限制
*/
if ((event->attr.sample_type & PERF_SAMPLE_PERIOD) && !event->attr.freq) {
data->period = nr;
return perf_swevent_overflow(event, 1, data, regs);
} else
data->period = event->hw.last_period;

/* (3.2) 如果hwc->sample_period == 1,且是period模式
每次都是上报,不需要重新设置period,所以overflow参数 = 1
*/
if (nr == 1 && hwc->sample_period == 1 && !event->attr.freq)
return perf_swevent_overflow(event, 1, data, regs);

/* (4.1) 判断period有没有到期,没有到期的数据丢弃返回。 */
if (local64_add_negative(nr, &hwc->period_left))
return;

/* (4.2) period到期,上报数据。 */
perf_swevent_overflow(event, 0, data, regs);
}


static void perf_swevent_overflow(struct perf_event *event, u64 overflow,
struct perf_sample_data *data,
struct pt_regs *regs)
{
struct hw_perf_event *hwc = &event->hw;
int throttle = 0;

/* (4.2.1) overflow=0,说明是period到期后进来的,需要重新设置period
执行perf_swevent_set_period()返回的overflow是距离上一次上报经历了多少个period
*/
if (!overflow)
overflow = perf_swevent_set_period(event);

if (hwc->interrupts == MAX_INTERRUPTS)
return;

/* (4.2.2) overflow是上一次经历了多少个period,或者是overflow=1强制进来的
每个period上报一次数据
*/
for (; overflow; overflow--) {
if (__perf_event_overflow(event, throttle,
data, regs)) {
/*
* We inhibit the overflow from happening when
* hwc->interrupts == MAX_INTERRUPTS.
*/
break;
}
throttle = 1;
}
}


static int __perf_event_overflow(struct perf_event *event,
int throttle, struct perf_sample_data *data,
struct pt_regs *regs)
{
int events = atomic_read(&event->event_limit);
struct hw_perf_event *hwc = &event->hw;
u64 seq;
int ret = 0;

/*
* Non-sampling counters might still use the PMI to fold short
* hardware counters, ignore those.
*/
/* (4.2.2.1) 没有sample数据上报的返回 */
if (unlikely(!is_sampling_event(event)))
return 0;

/* (4.2.2.2) throttle的判断,还没看懂? */
seq = __this_cpu_read(perf_throttled_seq);
if (seq != hwc->interrupts_seq) {
hwc->interrupts_seq = seq;
hwc->interrupts = 1;
} else {
hwc->interrupts++;
if (unlikely(throttle
&& hwc->interrupts >= max_samples_per_tick)) {
__this_cpu_inc(perf_throttled_count);
hwc->interrupts = MAX_INTERRUPTS;
perf_log_throttle(event, 0);
tick_nohz_full_kick();
ret = 1;
}
}

/* (4.2.2.4) 如果是freq模式,根据count的发生频率,重新计算period值 */
if (event->attr.freq) {
u64 now = perf_clock();
s64 delta = now - hwc->freq_time_stamp;

hwc->freq_time_stamp = now;

if (delta > 0 && delta < 2*TICK_NSEC)
perf_adjust_period(event, delta, hwc->last_period, true);
}

/*
* XXX event_limit might not quite work as expected on inherited
* events
*/

/* (4.2.2.5) perf_event pending的处理,没看懂? */
event->pending_kill = POLL_IN;
if (events && atomic_dec_and_test(&event->event_limit)) {
ret = 1;
event->pending_kill = POLL_HUP;
event->pending_disable = 1;
irq_work_queue(&event->pending);
}

/* (4.2.2.6) 实际上报sample数据的地方了:
调用event自己的overflow_handler()函数,或者默认perf_event_output()函数
*/
if (event->overflow_handler)
event->overflow_handler(event, data, regs);
else
perf_event_output(event, data, regs);

if (*perf_event_fasync(event) && event->pending_kill) {
event->pending_wakeup = 1;
irq_work_queue(&event->pending);
}

return ret;
}

perf_event_output()是默认的上报sample数据函数:

1
2
3
4
5
6
7
8
9
10
11
12
13
14
15
16
17
18
19
20
21
22
23
24
25
26
27
28
29
30
31
32
33
34
35
36
37
38
39
40
41
42
43
44
45
46
47
48
49
50
51
52
53
54
55
56
57
58
59
60
61
62
63
64
65
66
67
68
69
70
71
72
73
74
75
76
77
78
79
80
81
82
83
84
85
86
87
88
89
90
91
92
93
94
95
96
97
98
99
100
101
102
103
104
105
106
107
108
109
110
111
112
113
114
115
116
117
118
119
120
121
122
123
124
125
126
127
128
129
130
131
132
133
134
135
136
137
138
139
140
141
142
143
144
145
146
147
148
149
150
151
152
153
154
155
156
157
158
159
160
161
162
163
164
165
166
167
168
169
170
171
172
173
174
175
176
177
178
179
180
181
182
183
184
185
186
187
188
189
190
191
192
193
194
195
196
197
198
199
200
201
202
203
204
205
void perf_event_output(struct perf_event *event,
struct perf_sample_data *data,
struct pt_regs *regs)
{
struct perf_output_handle handle;
struct perf_event_header header;

/* protect the callchain buffers */
rcu_read_lock();

/* (1) 计算sample数据的总长度,并且根据attr.sample_type保存额外的数据 */
perf_prepare_sample(&header, data, event, regs);

/* (2) 根据总size在event的ringbuffer中分配空间 */
if (perf_output_begin(&handle, event, header.size))
goto exit;

/* (3) 输出数据到ringbuffer中 */
perf_output_sample(&handle, &header, data, event);

/* (4) 把rb->head指针刷入rb->user_page->data_head */
perf_output_end(&handle);

exit:
rcu_read_unlock();
}

|→

int perf_output_begin(struct perf_output_handle *handle,
struct perf_event *event, unsigned int size)
{
struct ring_buffer *rb;
unsigned long tail, offset, head;
int have_lost, page_shift;
struct {
struct perf_event_header header;
u64 id;
u64 lost;
} lost_event;

rcu_read_lock();
/*
* For inherited events we send all the output towards the parent.
*/
/* (2.1) 由于inherit创建的子进程,都使用父进程的ringbuffer */
if (event->parent)
event = event->parent;

rb = rcu_dereference(event->rb);
if (unlikely(!rb))
goto out;

if (unlikely(!rb->nr_pages))
goto out;

handle->rb = rb;
handle->event = event;

have_lost = local_read(&rb->lost);
if (unlikely(have_lost)) {
size += sizeof(lost_event);
if (event->attr.sample_id_all)
size += event->id_header_size;
}

perf_output_get_handle(handle);

/* (2.2) 在ringbuffer中寻找一块空间 */
do {
/* (2.2.1) tail指针从user_page中获取,head指针从rb结构中获取
只有把数据写入确认写入以后,才会把head指针的改动从rb结构刷入user_page
*/
tail = READ_ONCE(rb->user_page->data_tail);
offset = head = local_read(&rb->head);
if (!rb->overwrite &&
unlikely(CIRC_SPACE(head, tail, perf_data_size(rb)) < size))
goto fail;

/*
* The above forms a control dependency barrier separating the
* @tail load above from the data stores below. Since the @tail
* load is required to compute the branch to fail below.
*
* A, matches D; the full memory barrier userspace SHOULD issue
* after reading the data and before storing the new tail
* position.
*
* See perf_output_put_handle().
*/

head += size;
} while (local_cmpxchg(&rb->head, offset, head) != offset);

/*
* We rely on the implied barrier() by local_cmpxchg() to ensure
* none of the data stores below can be lifted up by the compiler.
*/

if (unlikely(head - local_read(&rb->wakeup) > rb->watermark))
local_add(rb->watermark, &rb->wakeup);

page_shift = PAGE_SHIFT + page_order(rb);

/* (2.3) 计算分配得到的buffer的第一个page偏移和size */
handle->page = (offset >> page_shift) & (rb->nr_pages - 1);
offset &= (1UL << page_shift) - 1;
handle->addr = rb->data_pages[handle->page] + offset;
handle->size = (1UL << page_shift) - offset;

if (unlikely(have_lost)) {
struct perf_sample_data sample_data;

lost_event.header.size = sizeof(lost_event);
lost_event.header.type = PERF_RECORD_LOST;
lost_event.header.misc = 0;
lost_event.id = event->id;
lost_event.lost = local_xchg(&rb->lost, 0);

perf_event_header__init_id(&lost_event.header,
&sample_data, event);
perf_output_put(handle, lost_event);
perf_event__output_id_sample(event, handle, &sample_data);
}

return 0;

fail:
local_inc(&rb->lost);
perf_output_put_handle(handle);
out:
rcu_read_unlock();

return -ENOSPC;
}

|→

void perf_output_end(struct perf_output_handle *handle)
{
perf_output_put_handle(handle);
rcu_read_unlock();
}


static void perf_output_put_handle(struct perf_output_handle *handle)
{
struct ring_buffer *rb = handle->rb;
unsigned long head;

again:
head = local_read(&rb->head);

/*
* IRQ/NMI can happen here, which means we can miss a head update.
*/

if (!local_dec_and_test(&rb->nest))
goto out;

/*
* Since the mmap() consumer (userspace) can run on a different CPU:
*
* kernel user
*
* if (LOAD ->data_tail) { LOAD ->data_head
* (A) smp_rmb() (C)
* STORE $data LOAD $data
* smp_wmb() (B) smp_mb() (D)
* STORE ->data_head STORE ->data_tail
* }
*
* Where A pairs with D, and B pairs with C.
*
* In our case (A) is a control dependency that separates the load of
* the ->data_tail and the stores of $data. In case ->data_tail
* indicates there is no room in the buffer to store $data we do not.
*
* D needs to be a full barrier since it separates the data READ
* from the tail WRITE.
*
* For B a WMB is sufficient since it separates two WRITEs, and for C
* an RMB is sufficient since it separates two READs.
*
* See perf_output_begin().
*/
smp_wmb(); /* B, matches C */
rb->user_page->data_head = head;

/*
* Now check if we missed an update -- rely on previous implied
* compiler barriers to force a re-read.
*/
if (unlikely(head != local_read(&rb->head))) {
local_inc(&rb->nest);
goto again;
}

if (handle->wakeup != local_read(&rb->wakeup))
perf_output_wakeup(handle);

out:
preempt_enable();
}

perf_k_pmu_tp_sample_format

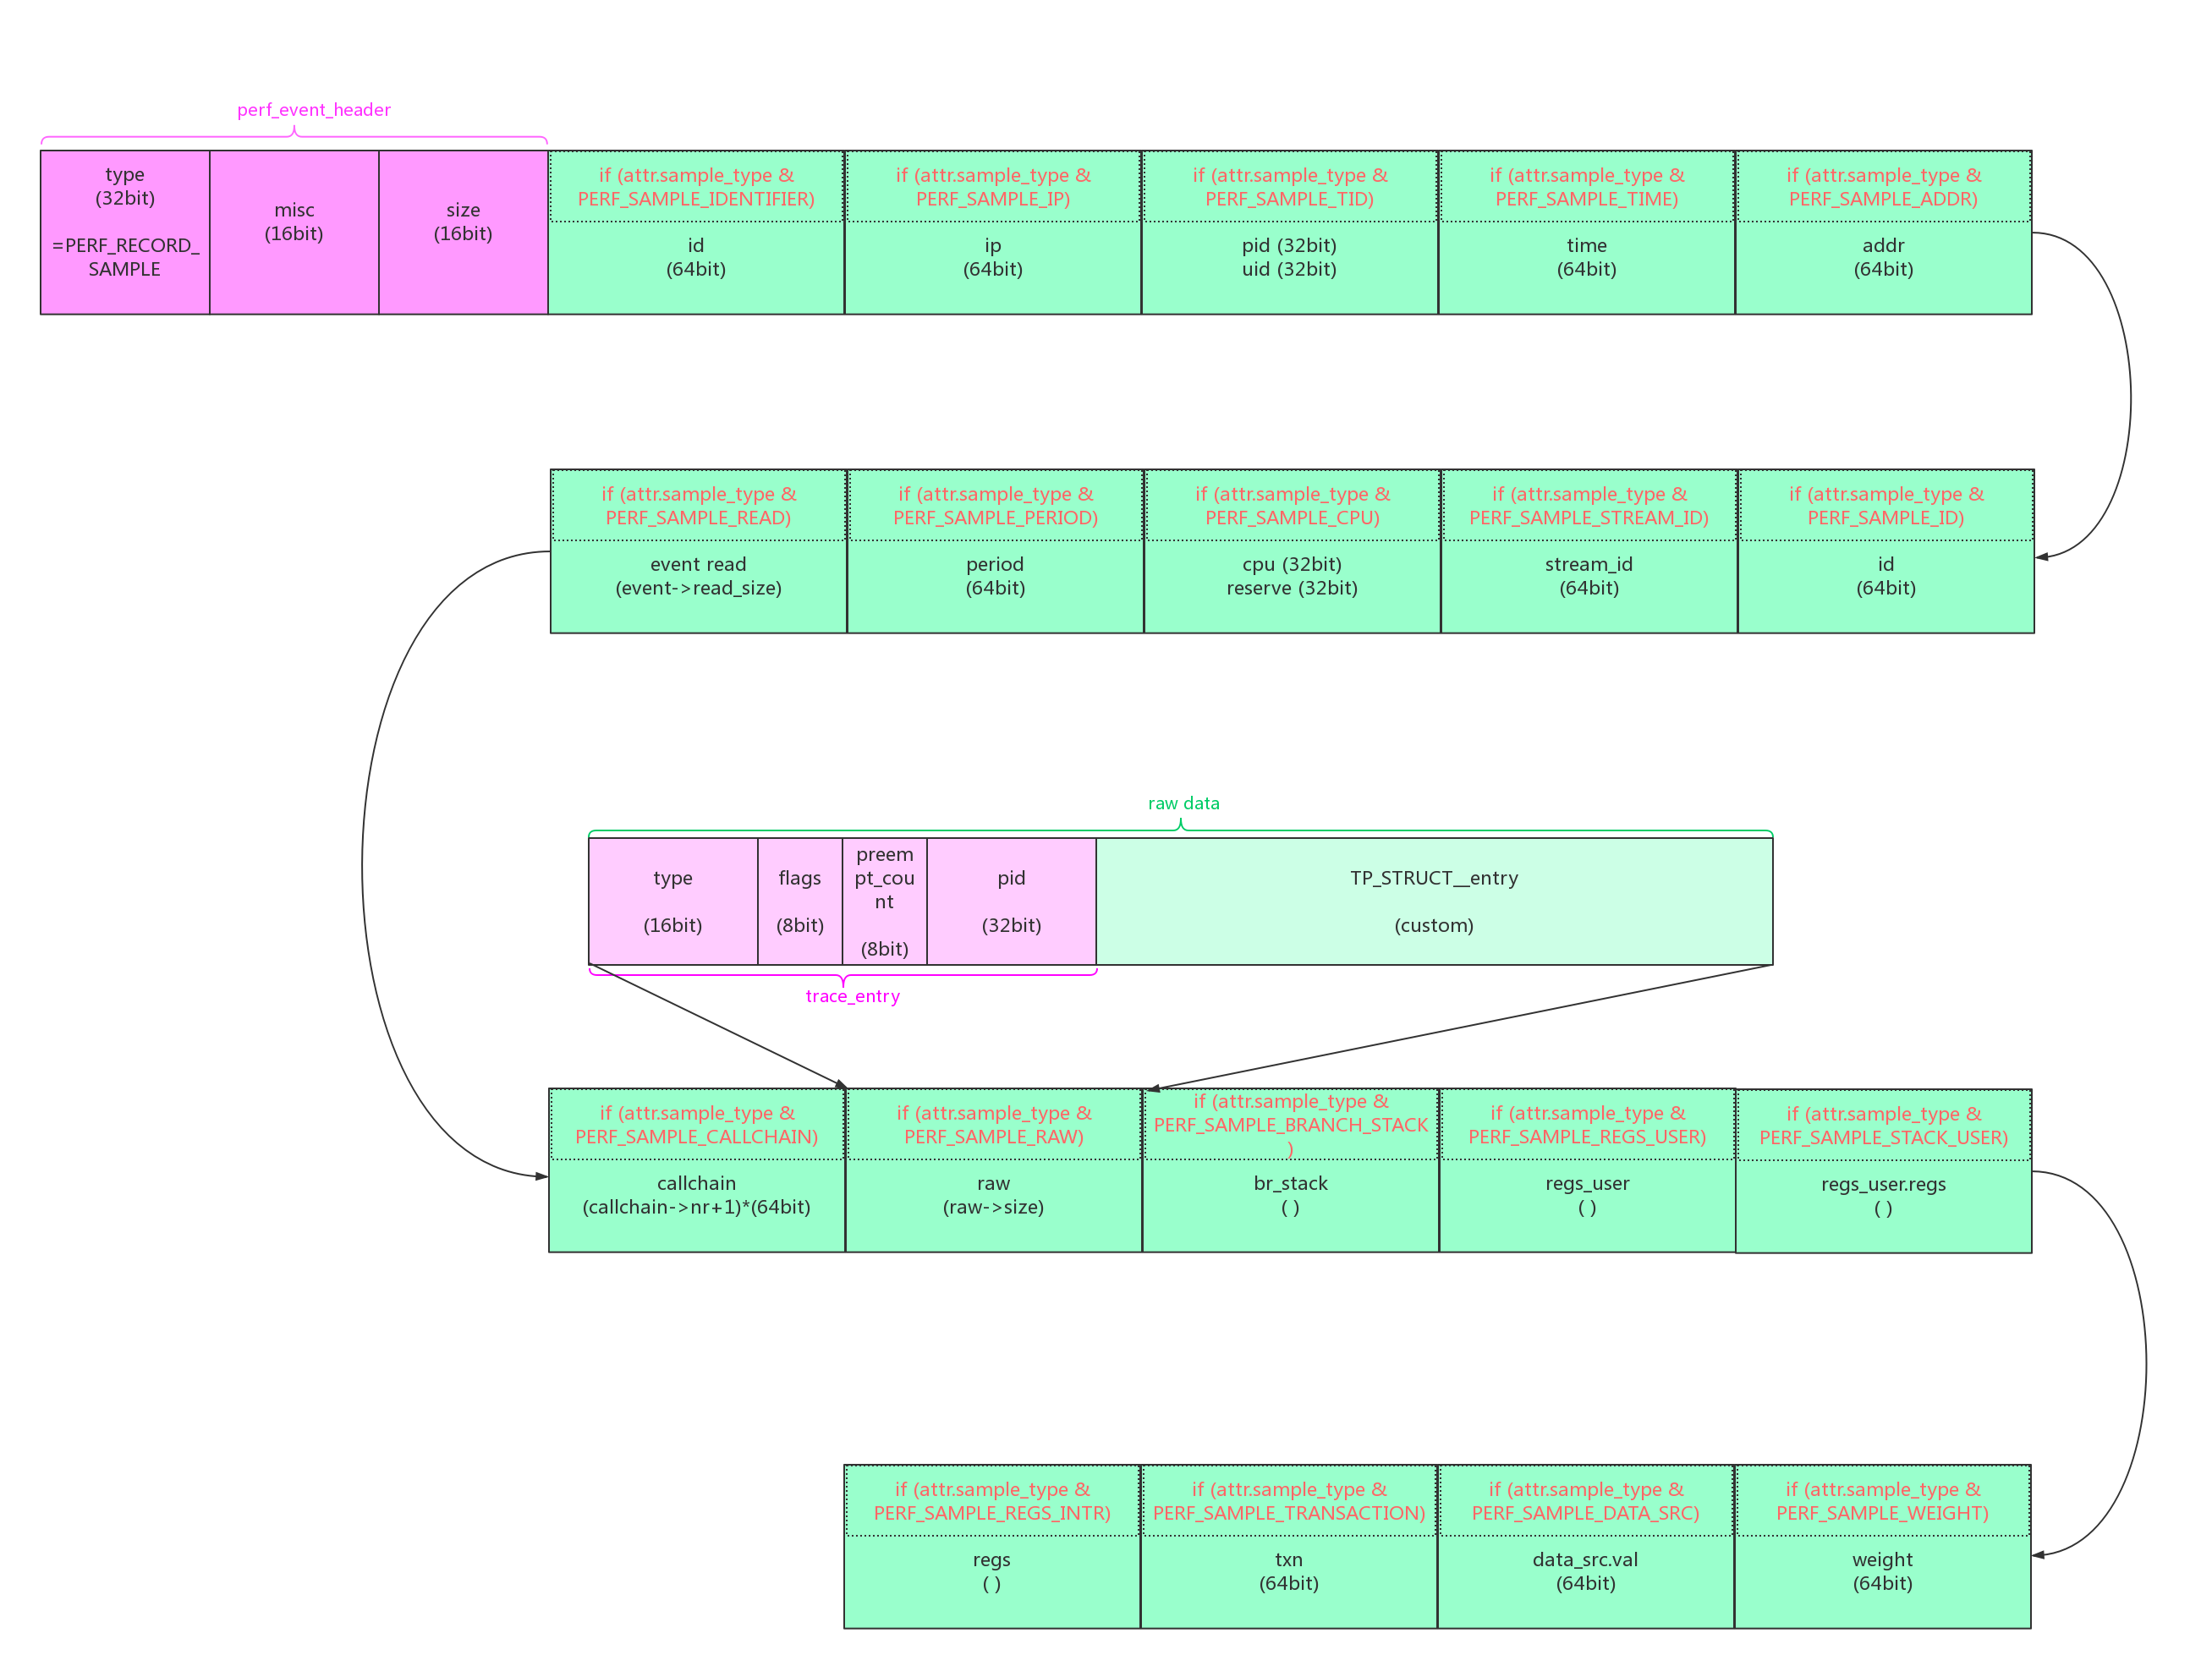
perf_event_type中详细描述了各种type类型的sample数据排列模式:

1
2
3
4
5
6
7
8
9
10
11
12
13
14
15
16
17
18
19
20
21
22
23
24
25
26
27
28
29
30
31
32
33
34
35
36
37
38
39
40
41
42
43
44
45
46
47
48
49
50
51
52
53
54
55
56
57
58
59
60
61
62
63
64
65
66
67
68
69
70
71
72
73
74
75
76
77
78
79
80
81
82
83
84
85
86
87
88
89
90
91
92
93
94
95
96
97
98
99
100
101
102
103
104
105
106
107
108
109
110
111
112
113
114
115
116
117
118
119
120
121
122
123
124
125
126
127
128
129
130
131
132
133
134
135
136
137
138
139
140
141
142
143
144
145
146
147
148
149
150
151
152
153
154
155
156
157
158
159
160
161
162
163
164
165
166
167
168
169
170
171
172
173
174
175
176
177
178
179
180
181
182
183
184
185
186
187
188
189
190
191
192
193
194
195
196
197
198
199
200
201
202
203
204
205
206
207
208
209
210
211
212
213
214
215
216
217
218
219
220
221
222
223
224
225
226
227
228
229
230
231
232
233
234
235
236
237
238
239
240
241
242
243
244
245
246
247
248
249
250
251
252
253
254
enum perf_event_type {

/*
* If perf_event_attr.sample_id_all is set then all event types will
* have the sample_type selected fields related to where/when
* (identity) an event took place (TID, TIME, ID, STREAM_ID, CPU,
* IDENTIFIER) described in PERF_RECORD_SAMPLE below, it will be stashed
* just after the perf_event_header and the fields already present for
* the existing fields, i.e. at the end of the payload. That way a newer
* perf.data file will be supported by older perf tools, with these new
* optional fields being ignored.
*
* struct sample_id {
* { u32 pid, tid; } && PERF_SAMPLE_TID
* { u64 time; } && PERF_SAMPLE_TIME
* { u64 id; } && PERF_SAMPLE_ID
* { u64 stream_id;} && PERF_SAMPLE_STREAM_ID
* { u32 cpu, res; } && PERF_SAMPLE_CPU
* { u64 id; } && PERF_SAMPLE_IDENTIFIER
* } && perf_event_attr::sample_id_all
*
* Note that PERF_SAMPLE_IDENTIFIER duplicates PERF_SAMPLE_ID. The
* advantage of PERF_SAMPLE_IDENTIFIER is that its position is fixed
* relative to header.size.
*/

/*
* The MMAP events record the PROT_EXEC mappings so that we can
* correlate userspace IPs to code. They have the following structure:
*
* struct {
* struct perf_event_header header;
*
* u32 pid, tid;
* u64 addr;
* u64 len;
* u64 pgoff;
* char filename[];
* struct sample_id sample_id;
* };
*/
PERF_RECORD_MMAP = 1,

/*
* struct {
* struct perf_event_header header;
* u64 id;
* u64 lost;
* struct sample_id sample_id;
* };
*/
PERF_RECORD_LOST = 2,

/*
* struct {
* struct perf_event_header header;
*
* u32 pid, tid;
* char comm[];
* struct sample_id sample_id;
* };
*/
PERF_RECORD_COMM = 3,

/*
* struct {
* struct perf_event_header header;
* u32 pid, ppid;
* u32 tid, ptid;
* u64 time;
* struct sample_id sample_id;
* };
*/
PERF_RECORD_EXIT = 4,

/*
* struct {
* struct perf_event_header header;
* u64 time;
* u64 id;
* u64 stream_id;
* struct sample_id sample_id;
* };
*/
PERF_RECORD_THROTTLE = 5,
PERF_RECORD_UNTHROTTLE = 6,

/*
* struct {
* struct perf_event_header header;
* u32 pid, ppid;
* u32 tid, ptid;
* u64 time;
* struct sample_id sample_id;
* };
*/
PERF_RECORD_FORK = 7,

/*
* struct {
* struct perf_event_header header;
* u32 pid, tid;
*
* struct read_format values;
* struct sample_id sample_id;
* };
*/
PERF_RECORD_READ = 8,

/*
* struct {
* struct perf_event_header header;
*
* #
* # Note that PERF_SAMPLE_IDENTIFIER duplicates PERF_SAMPLE_ID.
* # The advantage of PERF_SAMPLE_IDENTIFIER is that its position
* # is fixed relative to header.
* #
*
* { u64 id; } && PERF_SAMPLE_IDENTIFIER
* { u64 ip; } && PERF_SAMPLE_IP
* { u32 pid, tid; } && PERF_SAMPLE_TID
* { u64 time; } && PERF_SAMPLE_TIME
* { u64 addr; } && PERF_SAMPLE_ADDR
* { u64 id; } && PERF_SAMPLE_ID
* { u64 stream_id;} && PERF_SAMPLE_STREAM_ID
* { u32 cpu, res; } && PERF_SAMPLE_CPU
* { u64 period; } && PERF_SAMPLE_PERIOD
*
* { struct read_format values; } && PERF_SAMPLE_READ
*
* { u64 nr,
* u64 ips[nr]; } && PERF_SAMPLE_CALLCHAIN
*
* #
* # The RAW record below is opaque data wrt the ABI
* #
* # That is, the ABI doesn't make any promises wrt to
* # the stability of its content, it may vary depending
* # on event, hardware, kernel version and phase of
* # the moon.
* #
* # In other words, PERF_SAMPLE_RAW contents are not an ABI.
* #
*
* { u32 size;
* char data[size];}&& PERF_SAMPLE_RAW
*
* { u64 nr;
* { u64 from, to, flags } lbr[nr];} && PERF_SAMPLE_BRANCH_STACK
*
* { u64 abi; # enum perf_sample_regs_abi
* u64 regs[weight(mask)]; } && PERF_SAMPLE_REGS_USER
*
* { u64 size;
* char data[size];
* u64 dyn_size; } && PERF_SAMPLE_STACK_USER
*
* { u64 weight; } && PERF_SAMPLE_WEIGHT
* { u64 data_src; } && PERF_SAMPLE_DATA_SRC
* { u64 transaction; } && PERF_SAMPLE_TRANSACTION
* { u64 abi; # enum perf_sample_regs_abi
* u64 regs[weight(mask)]; } && PERF_SAMPLE_REGS_INTR
* };
*/
PERF_RECORD_SAMPLE = 9,

/*
* The MMAP2 records are an augmented version of MMAP, they add
* maj, min, ino numbers to be used to uniquely identify each mapping
*
* struct {
* struct perf_event_header header;
*
* u32 pid, tid;
* u64 addr;
* u64 len;
* u64 pgoff;
* u32 maj;
* u32 min;
* u64 ino;
* u64 ino_generation;
* u32 prot, flags;
* char filename[];
* struct sample_id sample_id;
* };
*/
PERF_RECORD_MMAP2 = 10,

/*
* Records that new data landed in the AUX buffer part.
*
* struct {
* struct perf_event_header header;
*
* u64 aux_offset;
* u64 aux_size;
* u64 flags;
* struct sample_id sample_id;
* };
*/
PERF_RECORD_AUX = 11,

/*
* Indicates that instruction trace has started
*
* struct {
* struct perf_event_header header;
* u32 pid;
* u32 tid;
* };
*/
PERF_RECORD_ITRACE_START = 12,

/*
* Records the dropped/lost sample number.
*
* struct {
* struct perf_event_header header;
*
* u64 lost;
* struct sample_id sample_id;
* };
*/
PERF_RECORD_LOST_SAMPLES = 13,

/*
* Records a context switch in or out (flagged by
* PERF_RECORD_MISC_SWITCH_OUT). See also
* PERF_RECORD_SWITCH_CPU_WIDE.
*
* struct {
* struct perf_event_header header;
* struct sample_id sample_id;
* };
*/
PERF_RECORD_SWITCH = 14,

/*
* CPU-wide version of PERF_RECORD_SWITCH with next_prev_pid and
* next_prev_tid that are the next (switching out) or previous
* (switching in) pid/tid.
*
* struct {
* struct perf_event_header header;
* u32 next_prev_pid;
* u32 next_prev_tid;
* struct sample_id sample_id;
* };
*/
PERF_RECORD_SWITCH_CPU_WIDE = 15,

PERF_RECORD_MAX, /* non-ABI */
}