为什么有了ftrace又出来一个perf?因为ftrace只管抓trace数据并没有分析,perf在trace数据分析方面做出了很多成果。
在trace数据采集方面,perf复用了ftrace的所有插桩点,并且加入了采样法(硬件PMU)。PMU是一种非常重要的数据采集方法,因为它大部分是硬件的,所以可以做到一些软件做不到的事情,获取到一些底层硬件的信息。
perf的基本包装模型是这样的,对每一个event分配一个对应的perf_event结构。所有对event的操作都是围绕perf_event来展开的:
- 通过perf_event_open系统调用分配到perf_event以后,会返回一个文件句柄fd,这样这个perf_event结构可以通过read/write/ioctl/mmap通用文件接口来操作。
- perf_event提供两种类型的trace数据:count和sample。count只是记录了event的发生次数,sample记录了大量信息(比如:IP、ADDR、TID、TIME、CPU、BT)。如果需要使用sample功能,需要给perf_event分配ringbuffer空间,并且把这部分空间通过mmap映射到用户空间。这和定位问题时从粗到细的思路是相符的,首先从counter的比例上找出问题热点在哪个模块,再使用详细记录抓取更多信息来进一步定位。具体分别对应“perf stat”和“perf record/report”命令。
- perf的开销应该是比ftrace要大的,因为它给每个event都独立一套数据结构perf_event,对应独立的attr和pmu。在数据记录时的开销肯定大于ftrace,但是每个event的ringbuffer是独立的所以也不需要ftrace复杂的ringbuffer操作。perf也有比ftrace开销小的地方,它的sample数据存储的ringbuffer空间会通过mmap映射到到用户态,这样在读取数据的时候就会少一次拷贝。不过perf的设计初衷也不是让成百上千的event同时使用,只会挑出一些event重点debug。
0、perf_event的组织
从上面的描述看per就是一个个perf_event并不复杂,那么复杂在哪里呢?真正的难点在于对event的组织,怎么把全局的event的资源,按照用户的需要分割成cpu维度/task维度。
我们在分析问题的时候,并不是一下子深入到底层event直接来看数据(如果不加区别event记录的是整系统的数据),我们会遵从系统->cpu->进程来分析问题。针对实际的需求,perf使用cpu维度/task维度来组织perf_event。
我们具体来看看perf_event的组织方法:
1、cpu维度:
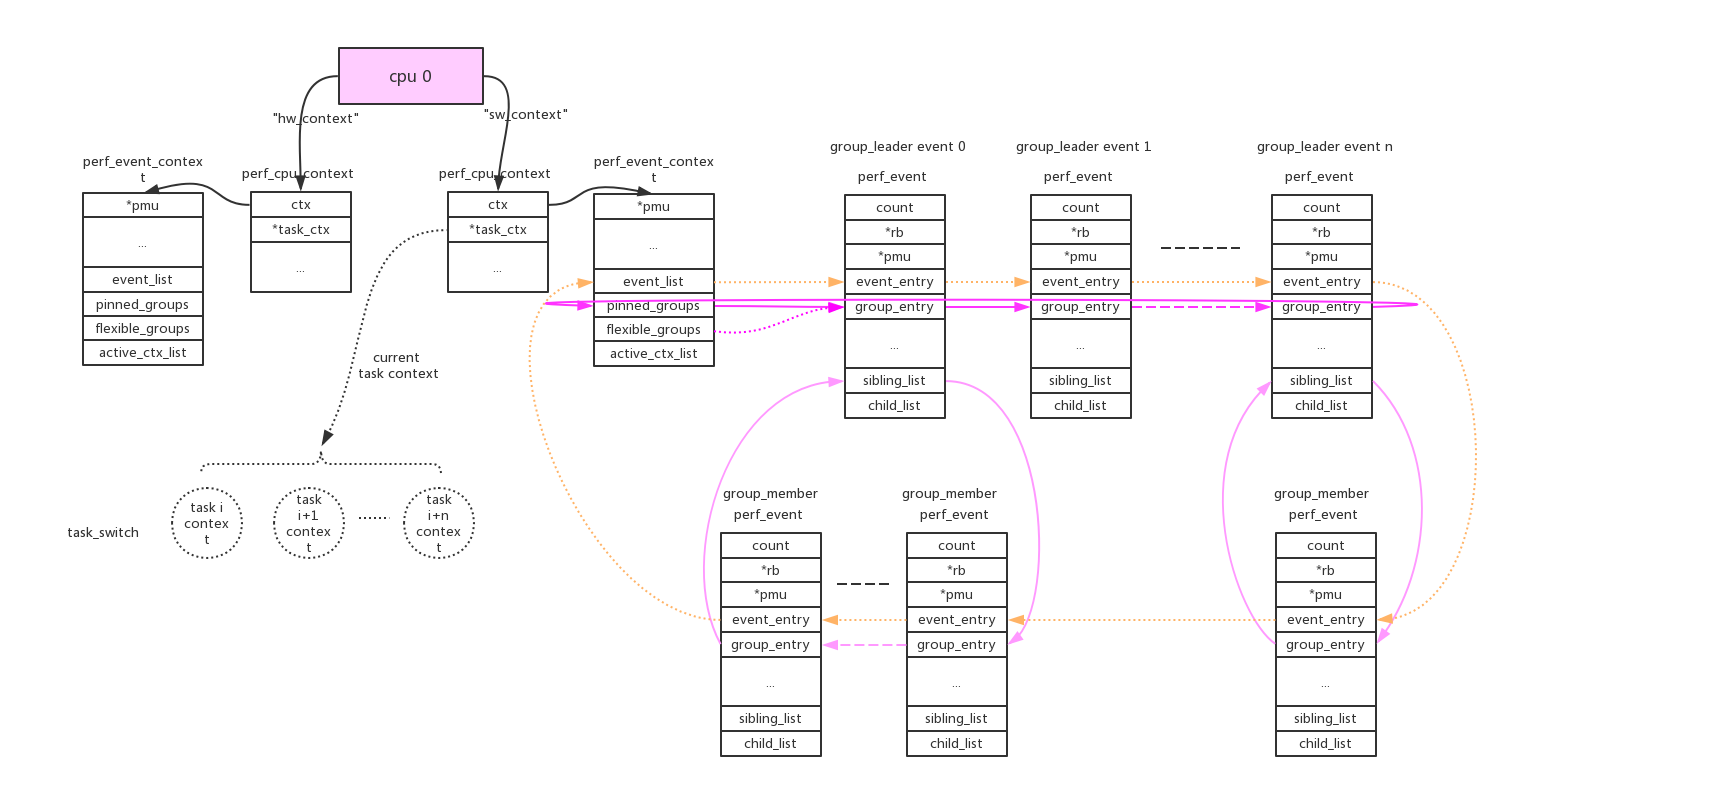
使用perf_event_context类型的链表来连接本cpu的相关perf_event。这样的链表共有两条(perf_hw_context = 0, perf_sw_context = 1),链表指针存放在per_cpu变量pmu->pmu_cpu_context.ctx中由所有同类型的pmu共享。
2、task维度:
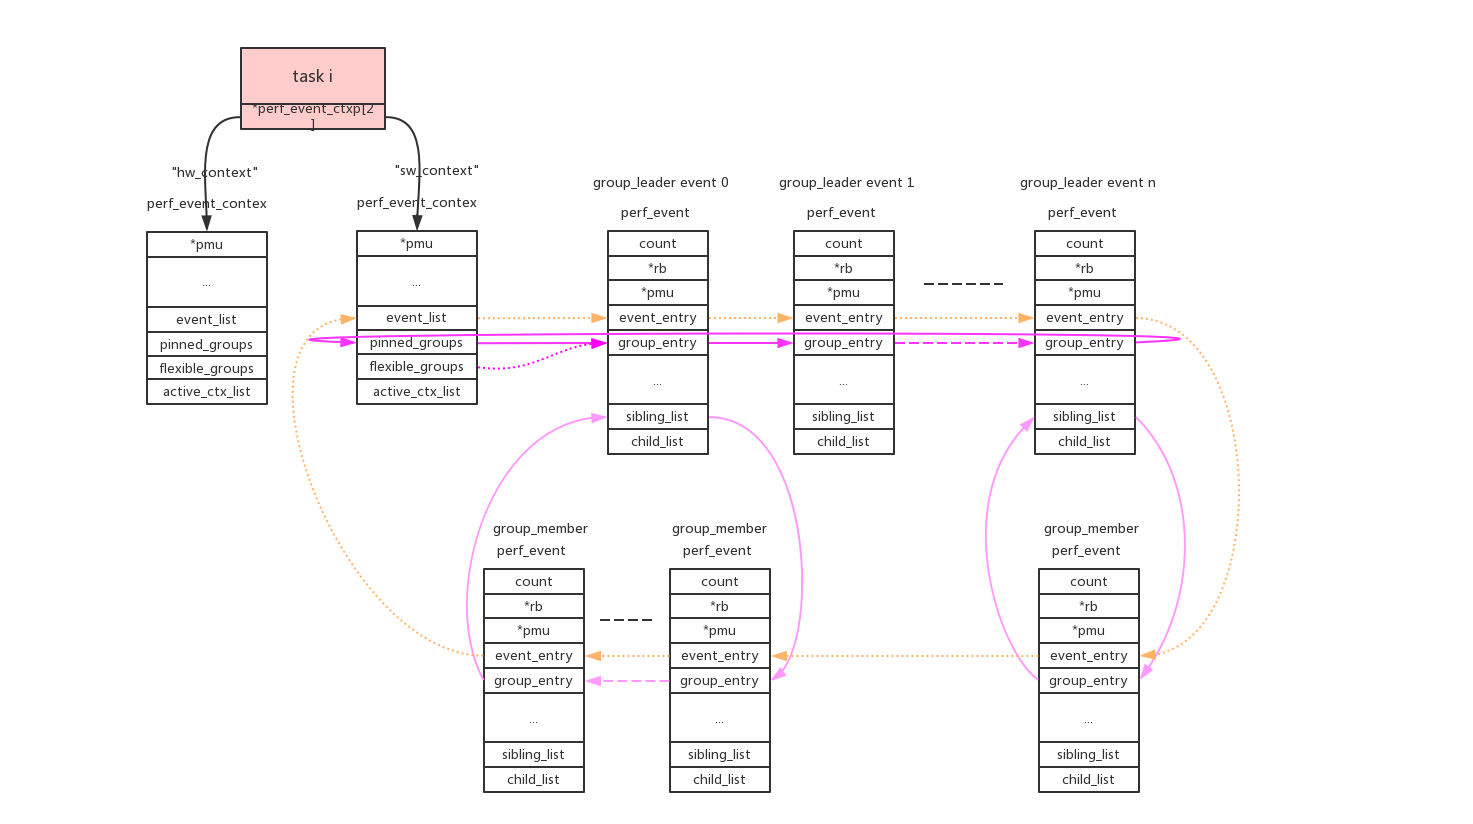
使用perf_event_context类型的链表来连接本task的相关perf_event。这样的链表共有两条(perf_hw_context = 0, perf_sw_context = 1),链表指针存放在task->perf_event_ctxp[ctxn]变量中。
3、perf_event_open()系统调用使用cpu、pid两个参数来指定perf_event的cpu、task维度。
pid == 0: event绑定到当前进程;
pid > 0: event绑定到指定进程;
pid == -1: event绑定到当前cpu的所有进程。
cpu >= 0: event绑定到指定cpu;
cpu == -1: event绑定到所有cpu;在同时指定的情况下task维度优先于cpu维度,所以pid、cpu组合起来有以下几种情况:
组合1:pid >= 0, cpu >= 0。perf_event绑定到task维度的context。task在得到cpu调度运行的时候,context上挂载的本task相关的perf_event也开始运行。但是如果event指定的cpu不等于当前运行的cpu,event不会得到执行,这样就符合了这个组合的含义;
组合2:pid >= 0, cpu == -1。perf_event绑定到task维度的context。只要task得到调度,该perf_event就会得到执行;
组合3:pid == -1, cpu >= 0。perf_event绑定到cpu维度的context。只要该cpu运行,该perf_event就会得到执行。目前只有在cpu online的情况下才能绑定perf_event,cpu hotplug支持可能会有问题;
组合4:pid == -1, cpu == -1。这种组合目前是非法的,相当于整系统所有cpu、所有进程。4、group leader:
cpu/task context使用->event_list链表来连接所有的perf_event。这些perf_event还允许以group的形式来组织,context使用->pinned_groups/flexible_groups链表来连接group leader的perf_event;group leader使用->sibling_list链表来连接所有的group member perf_event。组织形式参考上图。
group的作用是在read count的时候可以一次性读出group中所有perf_event的count。
perf_event_open()系统调用使用group_fd参数来指定perf_event的group_leader:>=0指定对于的perf_event为当前group_leader,== -1创建新的group_leader。
pinned:可以看到group leader被放到两个链表中(->pinned_groups/flexible_groups),attr.pinned=1指定放到高优先级链表->pinned_groups中。
(具体参见后面perf_install_in_context()的代码解析)
5、perf_task_sched。
对于cpu维度的perf_event来说只要cpu online会一直运行,而对于task维度的perf_event来说只有在task得到调度运行的时候event才能运行。所以在每个cpu上同时只能有一个task维度的perf_evnt得到执行,cpu维度的context使用了pmu->pmu_cpu_context->task_ctx指针来保存当前运行的task context。
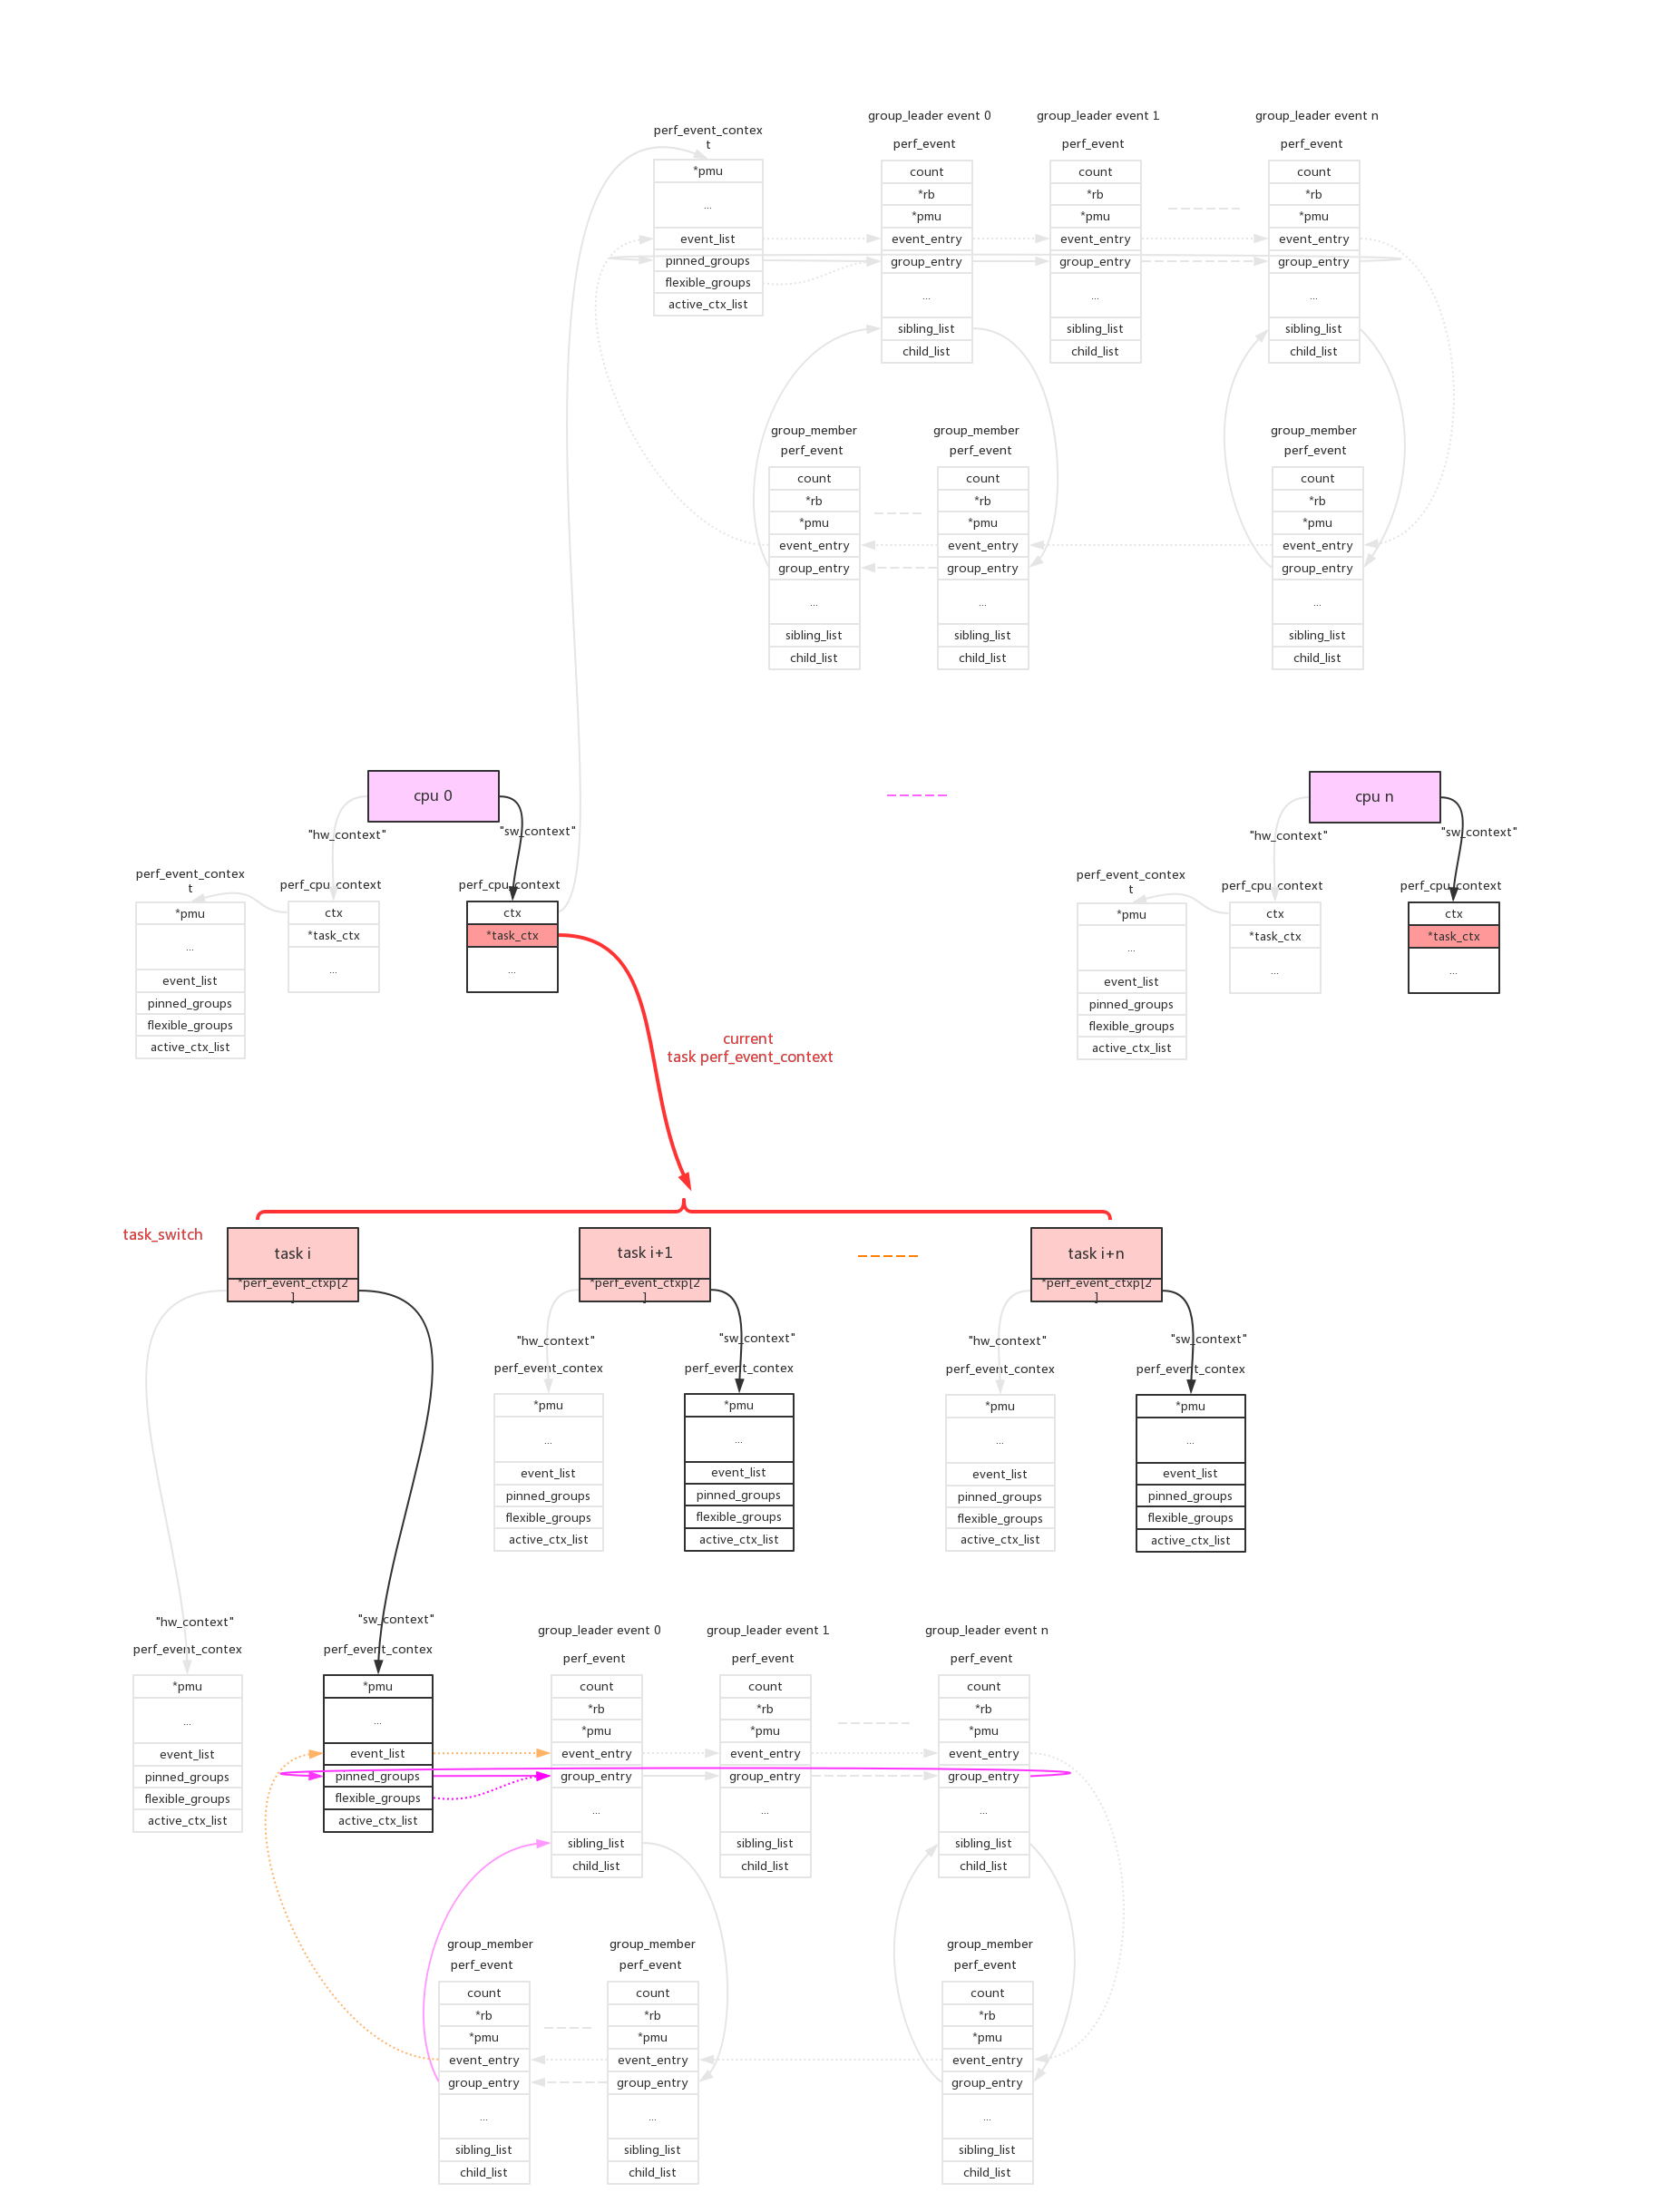
perf驱动层的精髓就在于此:在合适的时间合适的开关对应的perf_event。(具体参见后面perf_event_task_sched_in()、perf_event_task_sched_out()的代码解析)
在单个cpu上,多个任务调度时context/perf_event的开关情况:
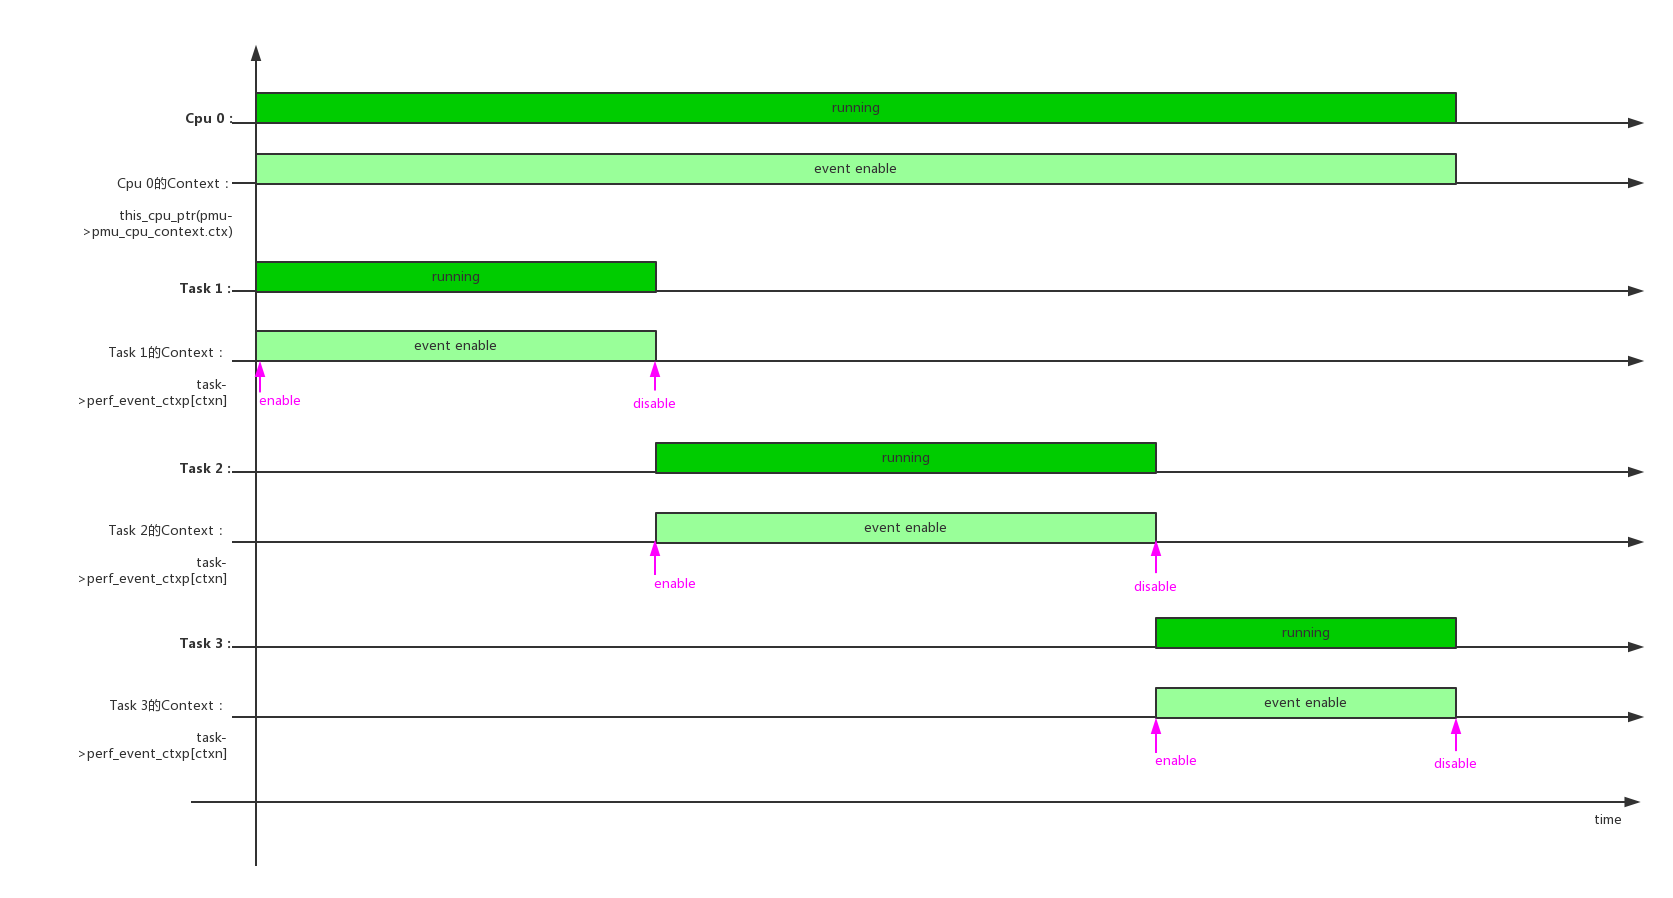
单个任务,在多个cpu上调度时context/perf_event的开关情况:

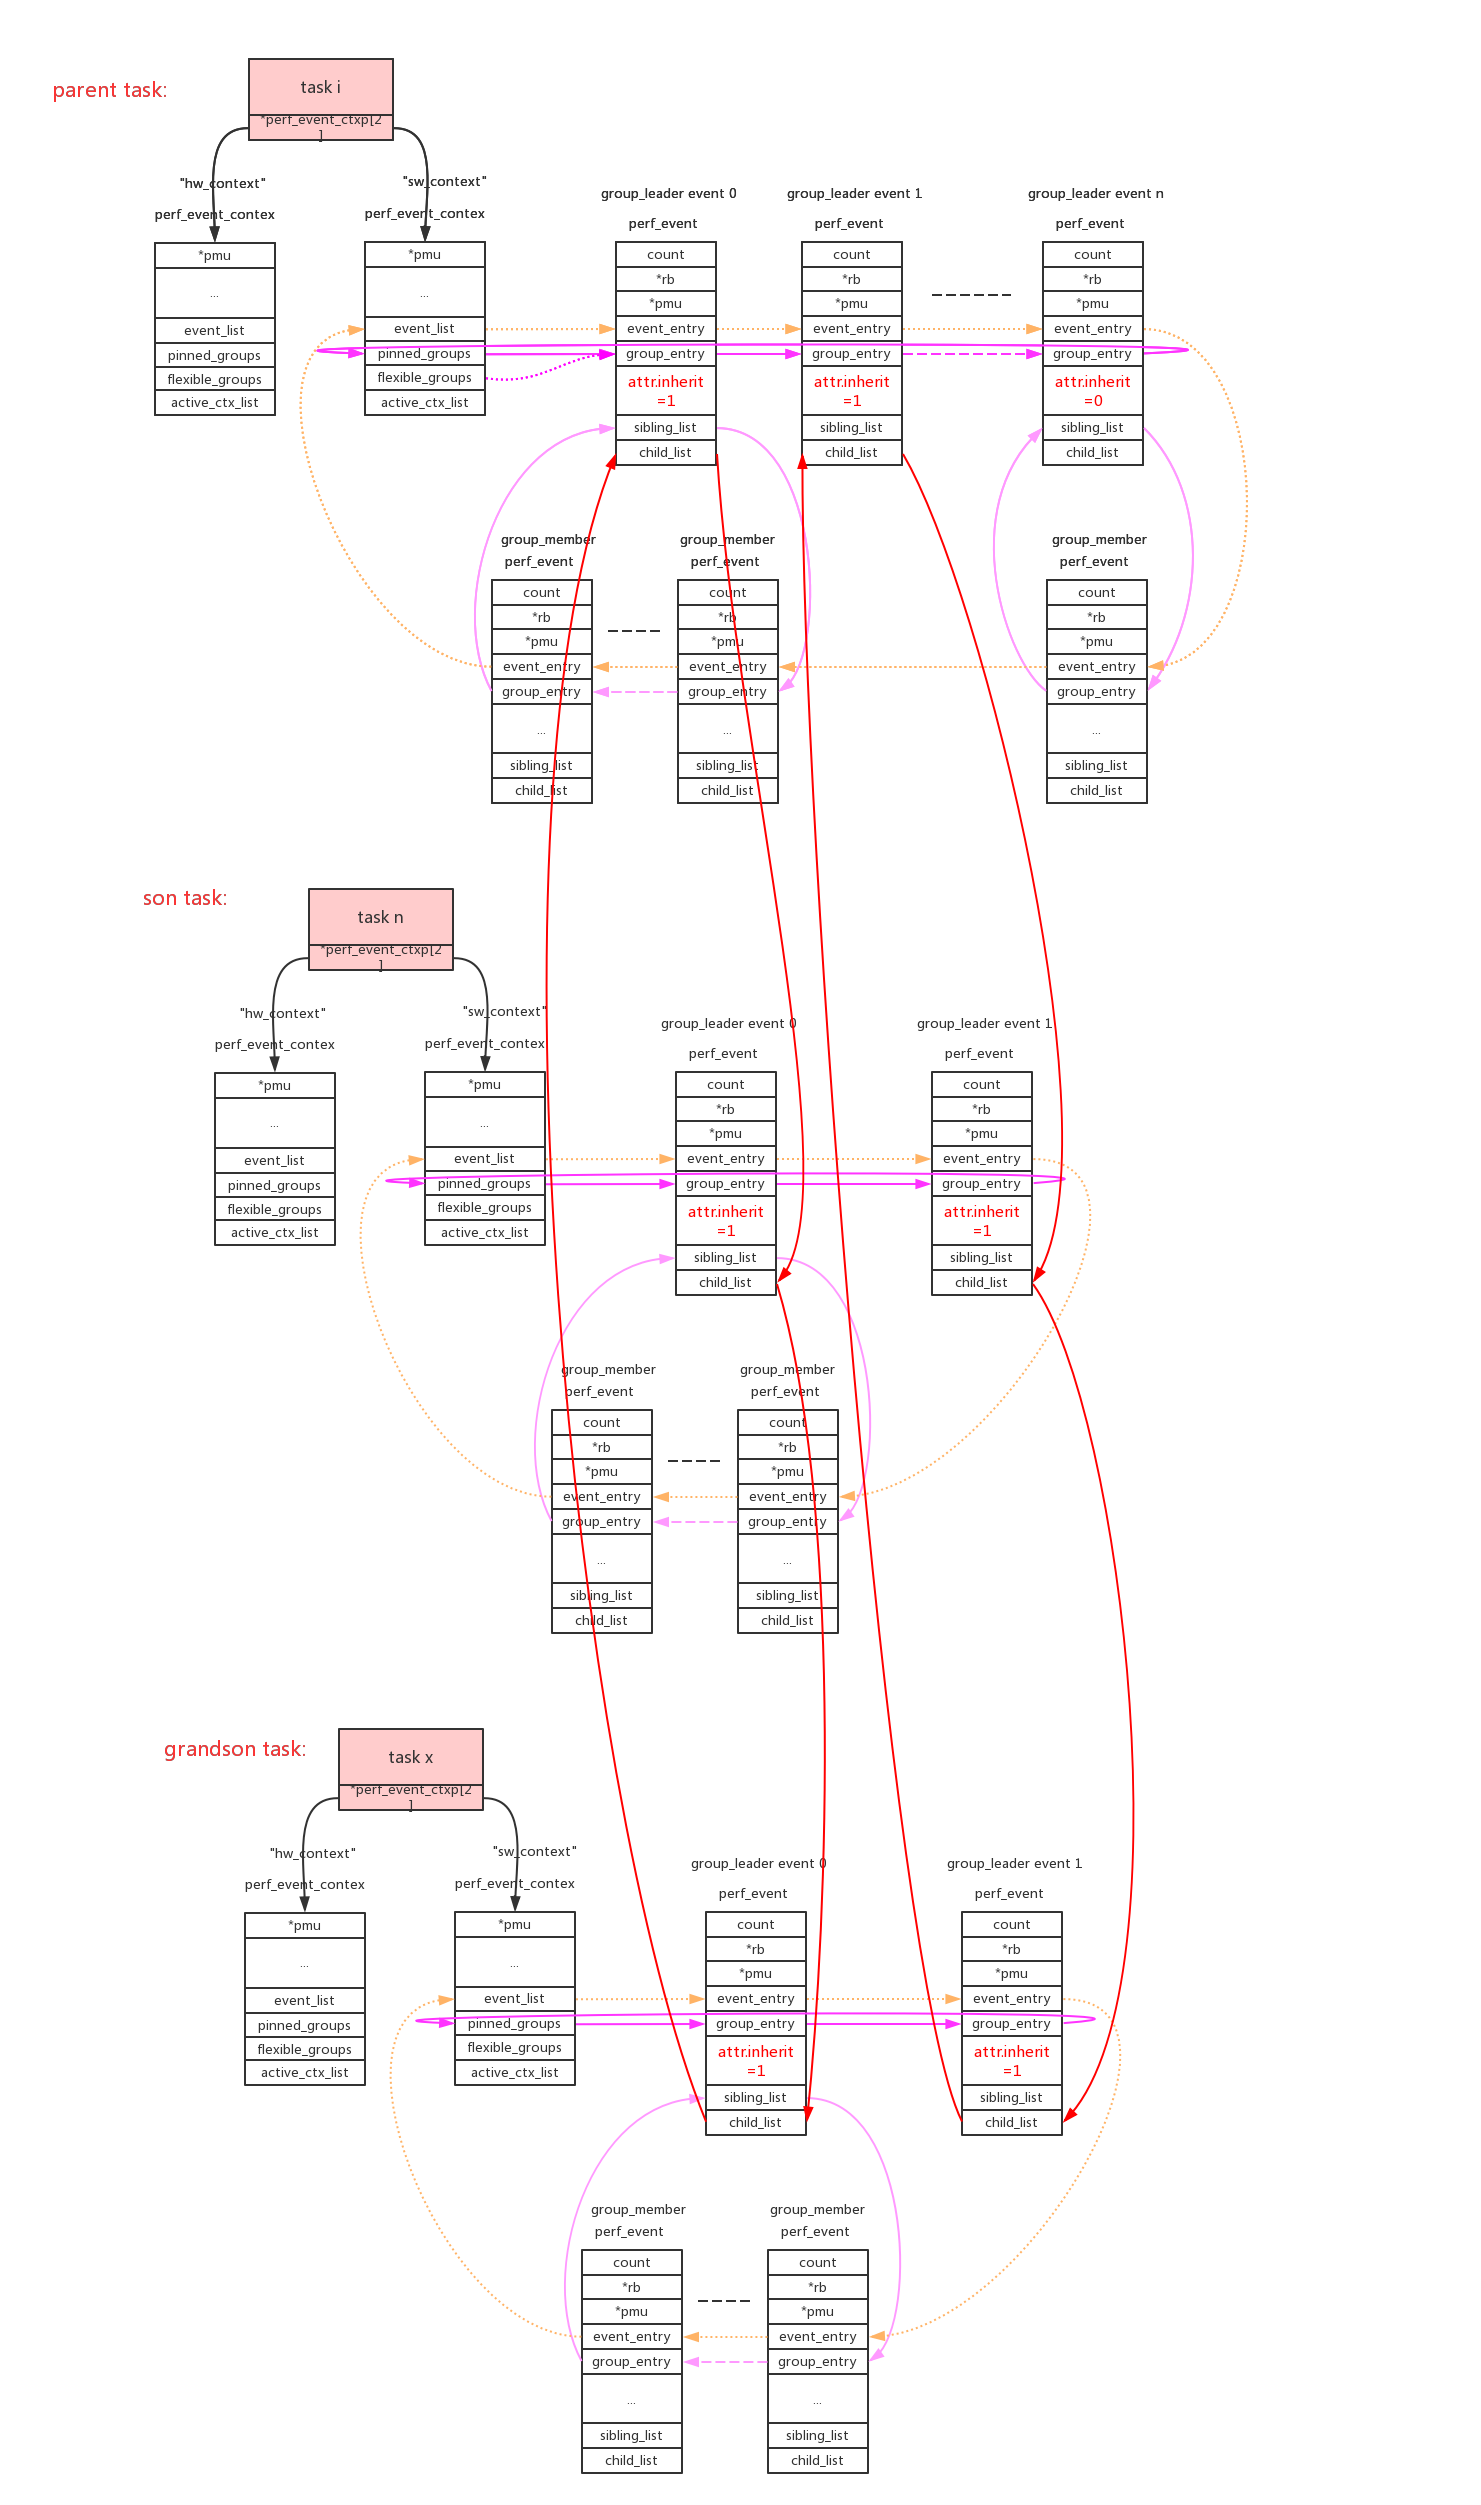
6、inherit:
inherit属性指定如果perf_event绑定的task创建子进程,event自动的对子进程也进行追踪。这在实际使用时是非常有用的,我们追踪一个app,随后它创建出的子进程/线程都能自动的被追踪。
父进程中所有attr.inherit=1的event被子进程所继承和复制,在使用PERF_FORMAT_GROUP读event的count值时,会把inherit所有子进程的值累加进来。(具体参见后面perf_event_init_task()、perf_read_group()的代码解析)
7、exclusive:
如果pmu有PERF_PMU_CAP_EXCLUSIVE属性,表明它要么只能被绑定为cpu维度、要么只能被绑定为task维度,不能混合绑定。(具体参见后面exclusive_event_init()的代码解析)
8、pmu的数据供给:
每个pmu拥有一个per_cpu的链表,perf_event需要在哪个cpu上获取数据就加入到哪个cpu的链表上。如果event被触发,它会根据当前的运行cpu给对应链表上的所有perf_event推送数据。
cpu维度的context:this_cpu_ptr(pmu->pmu_cpu_context->ctx)上链接的所有perf_event会根据绑定的pmu,链接到pmu对应的per_cpu的->perf_events链表上。
task维度的context:this_cpu_ptr(pmu->pmu_cpu_context->task_ctx)上链接的所有perf_event会根据绑定的pmu,链接到pmu对应的per_cpu的->perf_events链表上。perf_event还需要做cpu匹配,符合(event->cpu == -1 || event->cpu == smp_processor_id())条件的event才能链接到pmu上。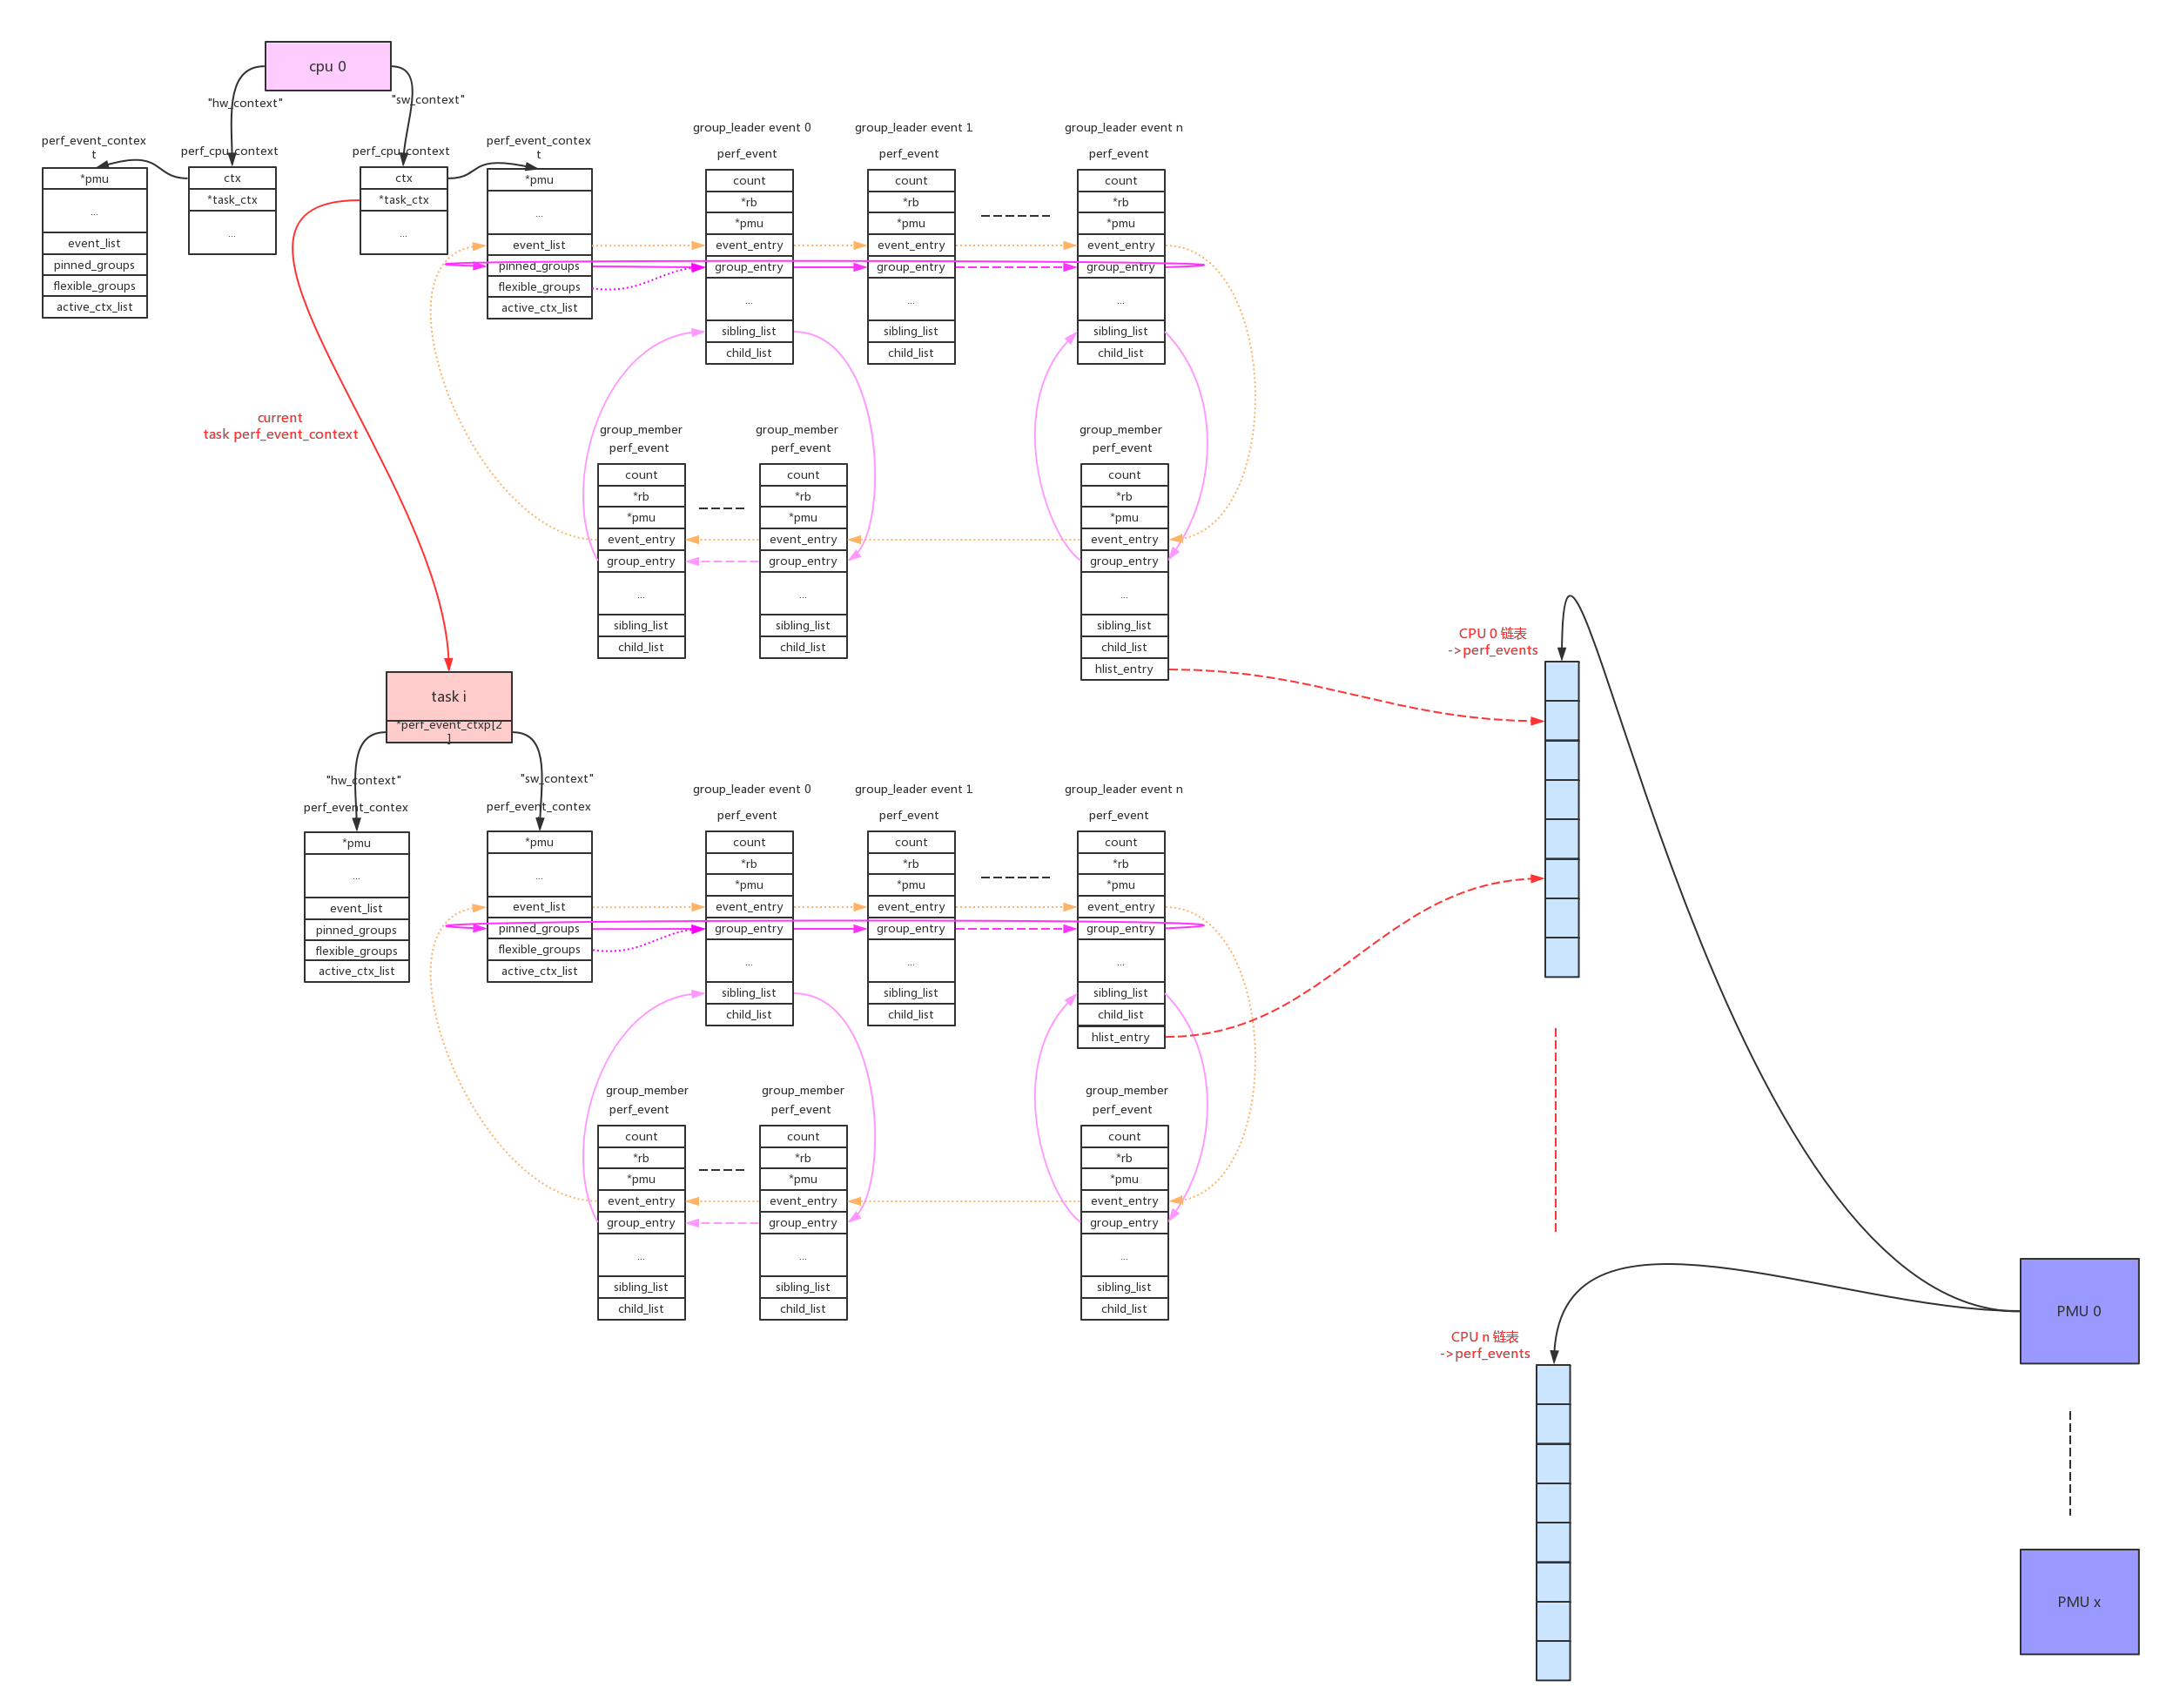
9、enable_on_exec:
perf_event的状态(event->state)典型值有以下3种:
disable:PERF_EVENT_STATE_OFF = -1, // 如果attr.disabled = 1,event->state的初始值
enable/inactive:PERF_EVENT_STATE_INACTIVE = 0, // 如果attr.disabled = 0,event->state的初始值
active:PERF_EVENT_STATE_ACTIVE = 1,attr.disabled属性决定了perf_event的初始化状态(disable/enable)。只有perf_event为enable以后才能参与schedule,在schedule过程中perf_event被使能时为active,关闭后恢复成enbale/inactive状态。
perf_event变成enable状态有3种方法:
1、attr.disabled = 0;
2、attr.disabled = 1,创建后使用ioctl的PERF_EVENT_IOC_ENABLE命令来使能;
3、attr.disabled = 1,attr.enable_on_exec = 1。这样使用execl执行新程序时使能event,这是一种非常巧妙的同步手段;10、ringbuffer:
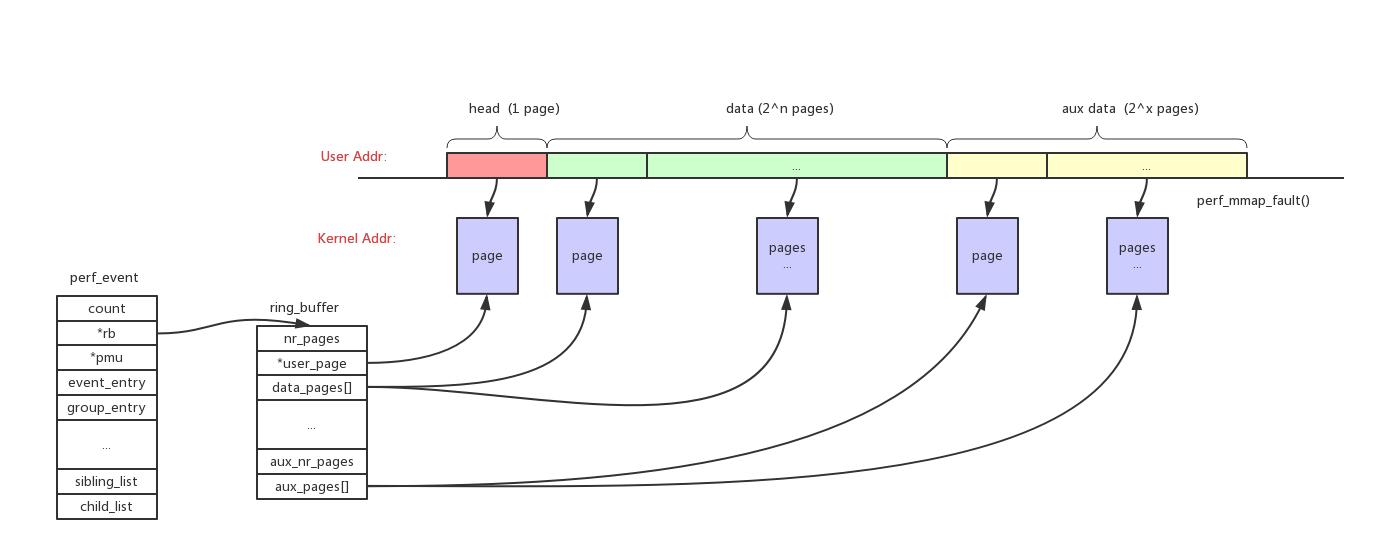
如果需要读取perf_event的sample类型的数据,需要先给perf_event分配一个对应的ringbuffer,为了减少开销这个ringbuffer会被mmap映射成用户态地址。
如上图所示整个ringbuffer空间分成3部分:
head:size = 1 page。主要用来存储控制数据,指针等等
data:size = 2^n pages。主要用来存储perf_event的sample数据
aux data:size = 2^n pages。作用暂时没有看明白如果perf_event支持inherit属性,那么它所有的子进程上继承的perf_event的sample数据,都会保存到父perf_event的ringbuffer中。perf_event可以inherit,但是ringbuffer不会重新分配,会共用父event的ringbuffer。
11、sample_period/sample_freq:
1、perf_event初始化
perf_event初始化的时候将各种pmu注册到pmus链表。
start_kernel() -> perf_event_init():
1 | void __init perf_event_init(void) |
另外一个函数perf_event_sysfs_init()会在稍后的device_initcall中,为所有“pmu->name != null”的pmu创建对应的device:
1 | static int __init perf_event_sysfs_init(void) |
可以在/sys路径下看到对应的device:
1 | # ls /sys/bus/event_source/devices/ |
2、perf_event_open系统调用
perf_event_open会创建event对应的perf_event结构,按照perf_event_attr参数把perf_event和对应的pmu以及perf_cpu_context(cpu维度/task维度)绑定,最后再把perf_event和perf_fops以及fd绑定,返回fd给系统进行文件操作。
理解perf_event_open系统调用先理解它的5个参数:
1 | perf_event_open(struct perf_event_attr attr, pid_t pid, int cpu, int group_fd, unsigned long flags) |
- 参数1、struct perf_event_attr attr。该参数是最复杂也是最重要的参数:
1 | struct perf_event_attr { |
参数2、pid_t pid:
pid == 0: event绑定到当前进程;
pid > 0: event绑定到指定进程;
pid < 0: event绑定到当前cpu的所有进程。参数3、int cpu:
cpu >= 0: event绑定到指定cpu;
cpu == -1: event绑定到所有cpu;
(注意’pid == -1’、’cpu == -1’同时存在是非法的)参数4、int group_fd:
group_fd = -1:创建一个新的group leader;
group_fd > 0:加入到之前创建的group leader中。参数5、unsigned long flags:
1 | #define PERF_FLAG_FD_NO_GROUP (1UL << 0) |
perf_event_open()函数的完全解析如下:
1 | SYSCALL_DEFINE5(perf_event_open, |
经过perf_event_open()调用以后返回perf_event对应的fd,后续的文件操作对应perf_fops:
1 | static const struct file_operations perf_fops = { |
后续会对其重点的函数perf_read()、perf_ioctl()、perf_mmap()一一进行解析。
2.1、inherit
进程通过task contex(task->perf_event_ctxp[ctxn])挂载了很多面向task的perf_event,如果event支持inherit属性,当进程创建子进程时需要给子进程创建task context和继承的event。
copy_process() -> perf_event_init_task() -> perf_event_init_context() -> inherit_task_group() -> inherit_group() -> inherit_event():
1 | int perf_event_init_task(struct task_struct *child) |
2.2、perf task sched
task context上链接的perf_event需要跟随task进程调度一起动态启动停止,在task得到调度时相关perf_event开始工作,在task被其他任务调度出去时相关perf_event停止工作。
为了支持这种行为,在task switch时调用perf的回调函数:perf_event_task_sched_out()/perf_event_task_sched_in()
context_switch() -> prepare_task_switch() -> perf_event_task_sched_out():
1 | static inline void perf_event_task_sched_out(struct task_struct *prev, |
context_switch() -> finish_task_switch() -> perf_event_task_sched_in():
1 | static inline void perf_event_task_sched_in(struct task_struct *prev, |
如果是pid>0,cpu!=-1的event,在sched_in的时候会调用event_filter_match()判断当前cpu和event绑定的cpu(event->cpu)是否一致,只有符合条件event才能被使能:
ctx_pinned_sched_in()/ctx_flexible_sched_in() -> event_filter_match():
1 | static inline int |
2.3、cgroup
暂不分析
3、perf_ioctl
通过perf_event_open()系统调用获得perf_event对应的fd后,可以通过操作fd的ioctl命令来配置perf_event。
1 | static long perf_ioctl(struct file *file, unsigned int cmd, unsigned long arg) |
3.1、_perf_event_enable
简单分析一下enable命令。该命令的主要作用就是把处于PERF_EVENT_STATE_OFF状态的event设置成PERF_EVENT_STATE_INACTIVE,以便该event能参与到perf sched当中去。
1 | static void _perf_event_enable(struct perf_event *event) |
另外也可以设置attr.enable_on_exec,在执行exec()新的应用时enable perf_event。
load_elf_binary() -> setup_new_exec() -> perf_event_exec() -> perf_event_enable_on_exec() -> event_enable_on_exec():
1 | static int event_enable_on_exec(struct perf_event *event, |
4、perf_read
perf_event提供两种类型的信息:counter和sample。其中counter类型的数据就是通过read()操作读取的,最后会调到perf_read()函数。
需要重点关注一下group方式的读并累加:它会读取所有相关的perf_event的count,并且累加起来。
1 | static ssize_t |
5、perf_mmap
如果需要读取perf_event的sample类型的数据,需要先给perf_event分配一个对应的ringbuffer,为了减少开销这个ringbuffer会被mmap映射成用户态地址。
所以分配ringbuffer空间和映射成用户态地址这个两个操作都在perf_mmap()函数中完成。
1 | static int perf_mmap(struct file *file, struct vm_area_struct *vma) |
参考资料:
1、Performance Counters for Linux