Linux Perf 1.4、hardware events

可以通过perf list命令来查看系统中的hardware event:

1
2
3
4
5
6
7
# simpleperf list hw
List of hardware events:
cpu-cycles
instructions
cache-references
cache-misses
branch-misses

还有hardware-cache event:

1
2
3
4
5
6
7
8
9
10
# simpleperf list cache
List of hw-cache events:
L1-dcache-loads
L1-dcache-load-misses
L1-dcache-stores
L1-dcache-store-misses
branch-loads
branch-load-misses
branch-stores
branch-store-misses

1、原理介绍:

1.1、hardware pmu

PMU(Performance Monitor Unit)本来指的就是硬件上的性能监控计数器(counter)。因为软件trace方法存在制约制约:1、软件大部分是插桩法,对于没有插桩的地方缺乏监控;2、软件使用hrtimer的采样法开销较大,而且不精确。所以使用硬件采样来trace是一个很好的补充。

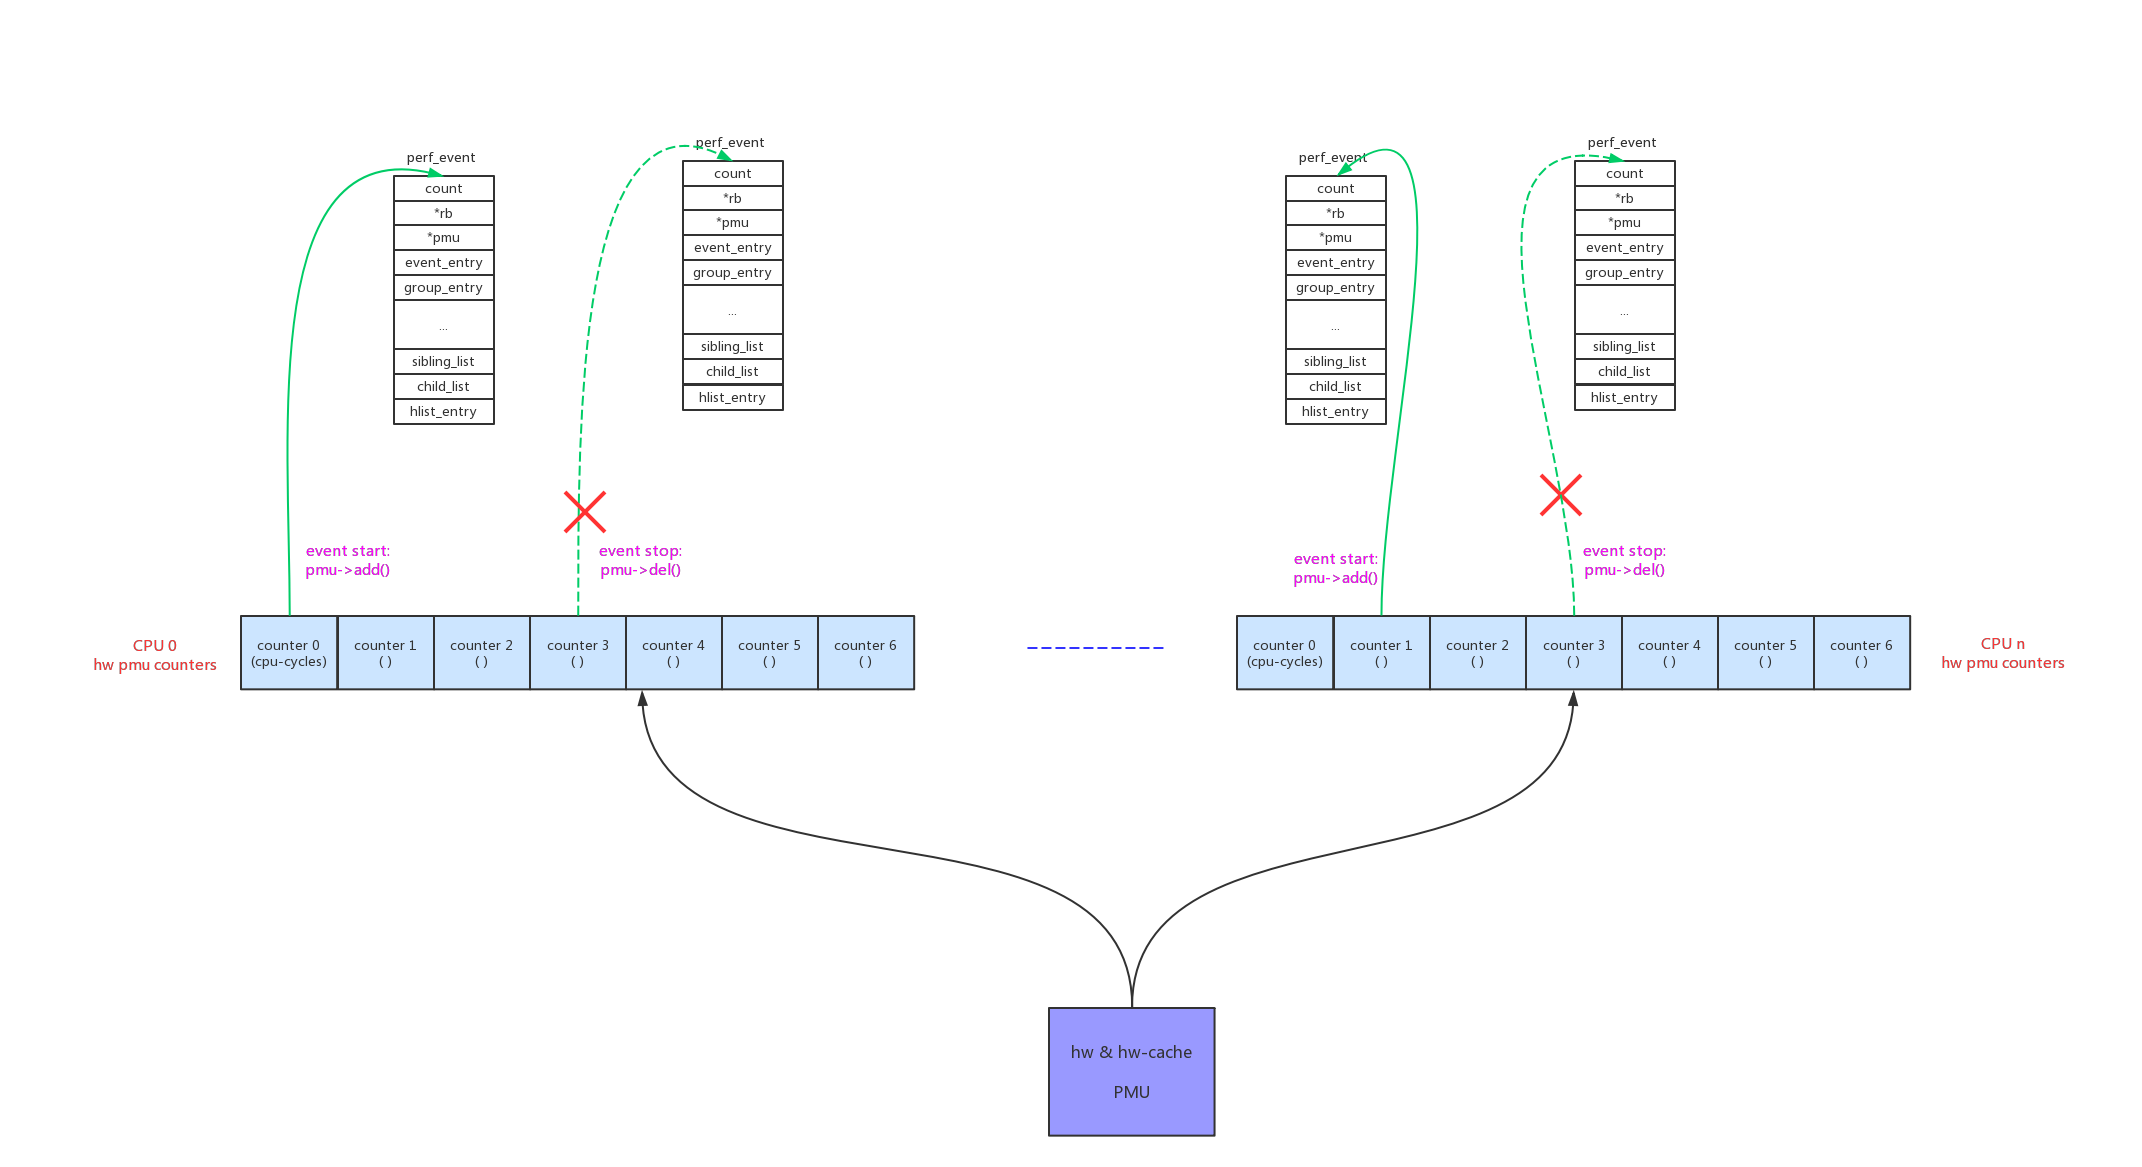
可以看到arm64的hardware pmu可以监控:cpu-cycles、instructions、cache-references、cache-misses、branch-misses、cache相关事件等等。它的监控原理比较简单:每个cpu有几个counter,counter 0固定只能配置成cpu-cycles,其他counter可以配置成支持的任意类型。当counter的计数达到我们配置的值后,产生中断,在中断中记录当前的pc等现场信息(sample数据)和累加counter计数(count数据)。

perf_k_pmu_hw_provide_data

我们可以利用pmu来做以下分析,例如:

  • 使用“instructions”每1000 instr采样一次,统计采样pc出现概率最大的函数,这样能找到当前的计算热点;
  • 使用“cache-misses”每10 miss采样一次,统计排序,找出“cache-misses”的热点;

arm64v3每个cpu支持7个counter,counter可配置的类型如下:

  • hw event。arm64支持的类型:
1
2
3
4
5
6
7
8
9
/* PMUv3 HW events mapping. */
const unsigned armv8_pmuv3_perf_map[PERF_COUNT_HW_MAX] = {
PERF_MAP_ALL_UNSUPPORTED,
[PERF_COUNT_HW_CPU_CYCLES] = ARMV8_PMUV3_PERFCTR_CLOCK_CYCLES,
[PERF_COUNT_HW_INSTRUCTIONS] = ARMV8_PMUV3_PERFCTR_INSTR_EXECUTED,
[PERF_COUNT_HW_CACHE_REFERENCES] = ARMV8_PMUV3_PERFCTR_L1_DCACHE_ACCESS,
[PERF_COUNT_HW_CACHE_MISSES] = ARMV8_PMUV3_PERFCTR_L1_DCACHE_REFILL,
[PERF_COUNT_HW_BRANCH_MISSES] = ARMV8_PMUV3_PERFCTR_PC_BRANCH_MIS_PRED,
};

arm hw event的全集:

1
2
3
4
5
6
7
8
9
10
11
12
13
14
15
16
17
18
19
20
21
22
/*
* Generalized performance event event_id types, used by the
* attr.event_id parameter of the sys_perf_event_open()
* syscall:
*/
enum perf_hw_id {
/*
* Common hardware events, generalized by the kernel:
*/
PERF_COUNT_HW_CPU_CYCLES = 0,
PERF_COUNT_HW_INSTRUCTIONS = 1,
PERF_COUNT_HW_CACHE_REFERENCES = 2,
PERF_COUNT_HW_CACHE_MISSES = 3,
PERF_COUNT_HW_BRANCH_INSTRUCTIONS = 4,
PERF_COUNT_HW_BRANCH_MISSES = 5,
PERF_COUNT_HW_BUS_CYCLES = 6,
PERF_COUNT_HW_STALLED_CYCLES_FRONTEND = 7,
PERF_COUNT_HW_STALLED_CYCLES_BACKEND = 8,
PERF_COUNT_HW_REF_CPU_CYCLES = 9,

PERF_COUNT_HW_MAX, /* non-ABI */
};
  • hw-cache event。三维数组,arm64支持的类型:
1
2
3
4
5
6
7
8
9
10
11
12
13
14
15
const unsigned armv8_pmuv3_perf_cache_map[PERF_COUNT_HW_CACHE_MAX]
[PERF_COUNT_HW_CACHE_OP_MAX]
[PERF_COUNT_HW_CACHE_RESULT_MAX] = {
PERF_CACHE_MAP_ALL_UNSUPPORTED,

[C(L1D)][C(OP_READ)][C(RESULT_ACCESS)] = ARMV8_PMUV3_PERFCTR_L1_DCACHE_ACCESS,
[C(L1D)][C(OP_READ)][C(RESULT_MISS)] = ARMV8_PMUV3_PERFCTR_L1_DCACHE_REFILL,
[C(L1D)][C(OP_WRITE)][C(RESULT_ACCESS)] = ARMV8_PMUV3_PERFCTR_L1_DCACHE_ACCESS,
[C(L1D)][C(OP_WRITE)][C(RESULT_MISS)] = ARMV8_PMUV3_PERFCTR_L1_DCACHE_REFILL,

[C(BPU)][C(OP_READ)][C(RESULT_ACCESS)] = ARMV8_PMUV3_PERFCTR_PC_BRANCH_PRED,
[C(BPU)][C(OP_READ)][C(RESULT_MISS)] = ARMV8_PMUV3_PERFCTR_PC_BRANCH_MIS_PRED,
[C(BPU)][C(OP_WRITE)][C(RESULT_ACCESS)] = ARMV8_PMUV3_PERFCTR_PC_BRANCH_PRED,
[C(BPU)][C(OP_WRITE)][C(RESULT_MISS)] = ARMV8_PMUV3_PERFCTR_PC_BRANCH_MIS_PRED,
};

arm hw-cache event的全集三维数组:

1
2
3
4
5
6
7
8
9
10
11
12
13
14
15
16
17
18
19
20
21
22
23
24
25
26
27
28
29
30
31
32
33
/*
* Generalized hardware cache events:
*
* { L1-D, L1-I, LLC, ITLB, DTLB, BPU, NODE } x
* { read, write, prefetch } x
* { accesses, misses }
*/
enum perf_hw_cache_id {
PERF_COUNT_HW_CACHE_L1D = 0,
PERF_COUNT_HW_CACHE_L1I = 1,
PERF_COUNT_HW_CACHE_LL = 2,
PERF_COUNT_HW_CACHE_DTLB = 3,
PERF_COUNT_HW_CACHE_ITLB = 4,
PERF_COUNT_HW_CACHE_BPU = 5,
PERF_COUNT_HW_CACHE_NODE = 6,

PERF_COUNT_HW_CACHE_MAX, /* non-ABI */
};

enum perf_hw_cache_op_id {
PERF_COUNT_HW_CACHE_OP_READ = 0,
PERF_COUNT_HW_CACHE_OP_WRITE = 1,
PERF_COUNT_HW_CACHE_OP_PREFETCH = 2,

PERF_COUNT_HW_CACHE_OP_MAX, /* non-ABI */
};

enum perf_hw_cache_op_result_id {
PERF_COUNT_HW_CACHE_RESULT_ACCESS = 0,
PERF_COUNT_HW_CACHE_RESULT_MISS = 1,

PERF_COUNT_HW_CACHE_RESULT_MAX, /* non-ABI */
};

x86系列pmu支持的监控类型更加丰富。

1.2、pmu init

在dts文件中定义了pmu的类型:

1
2
3
4
5
cpu_pmu: cpu-pmu {
compatible = "arm,armv8-pmuv3";
qcom,irq-is-percpu;
interrupts = <1 6 4>;
};

对应的驱动在drivers/perf/perf_event_armv8.c:

1
2
3
4
5
6
7
8
9
10
11
12
13
14
15
16
17
static const struct of_device_id armv8_pmu_of_device_ids[] = {
{.compatible = "arm,armv8-pmuv3", .data = armv8_pmuv3_init},
{.compatible = "arm,cortex-a53-pmu", .data = armv8_a53_pmu_init},
{.compatible = "arm,cortex-a57-pmu", .data = armv8_a57_pmu_init},
#ifdef CONFIG_ARCH_MSM8996
{.compatible = "qcom,kryo-pmuv3", .data = kryo_pmu_init},
#endif
{},
};

static struct platform_driver armv8_pmu_driver = {
.driver = {
.name = "armv8-pmu",
.of_match_table = armv8_pmu_of_device_ids,
},
.probe = armv8_pmu_device_probe,
};

我们分析它的初始化函数armv8_pmu_device_probe():

1
2
3
4
5
6
7
8
9
10
11
12
13
14
15
16
17
18
19
20
21
22
23
24
25
26
27
28
29
30
31
32
33
34
35
36
37
38
39
40
41
42
43
44
45
46
47
48
49
50
51
52
53
54
55
56
57
58
59
60
61
62
63
64
65
66
67
68
69
70
71
72
73
74
75
76
77
78
79
80
81
82
83
84
85
86
static int armv8_pmu_device_probe(struct platform_device *pdev)
{
return arm_pmu_device_probe(pdev, armv8_pmu_of_device_ids, NULL);
}


int arm_pmu_device_probe(struct platform_device *pdev,
const struct of_device_id *of_table,
const struct pmu_probe_info *probe_table)
{
const struct of_device_id *of_id;
const int (*init_fn)(struct arm_pmu *);
struct device_node *node = pdev->dev.of_node;
struct arm_pmu *pmu;
int ret = -ENODEV;

/* (1) 初始化arm_pmu结构,其中arm_pmu->pmu成员是标准的pmu结构 */
pmu = kzalloc(sizeof(struct arm_pmu), GFP_KERNEL);
if (!pmu) {
pr_info("failed to allocate PMU device!\n");
return -ENOMEM;
}

/* (2) 初始化标准pmu结构:arm_pmu->pmu */
armpmu_init(pmu);

if (!__oprofile_cpu_pmu)
__oprofile_cpu_pmu = pmu;

pmu->plat_device = pdev;

/* (3) arm_pmu通用部分的初始化 */
ret = cpu_pmu_init(pmu);
if (ret)
goto out_free;

/* (4) arm_pmu自定义部分的初始化,
"arm,armv8-pmuv3",对应init_fn = armv8_pmuv3_init
*/
if (node && (of_id = of_match_node(of_table, pdev->dev.of_node))) {
init_fn = of_id->data;

pmu->secure_access = of_property_read_bool(pdev->dev.of_node,
"secure-reg-access");

/* arm64 systems boot only as non-secure */
if (IS_ENABLED(CONFIG_ARM64) && pmu->secure_access) {
pr_warn("ignoring \"secure-reg-access\" property for arm64\n");
pmu->secure_access = false;
}

ret = of_pmu_irq_cfg(pmu);
if (!ret)
ret = init_fn(pmu);
} else {
ret = probe_current_pmu(pmu, probe_table);
cpumask_setall(&pmu->supported_cpus);
}

if (ret) {
pr_info("%s: failed to probe PMU!\n", of_node_full_name(node));
goto out_destroy;
}

/* (5) 注册标准的pmu */
ret = perf_pmu_register(&pmu->pmu, pmu->name, -1);
if (ret)
goto out_destroy;

pmu->pmu_state = ARM_PMU_STATE_OFF;
pmu->percpu_irq = -1;

pr_info("enabled with %s PMU driver, %d counters available\n",
pmu->name, pmu->num_events);

return 0;

out_destroy:
cpu_pmu_destroy(pmu);
out_free:
pr_info("%s: failed to register PMU devices!\n",
of_node_full_name(node));
kfree(pmu);
return ret;
}

armpmu_init()初始化标准pmu结构:

1
2
3
4
5
6
7
8
9
10
11
12
13
14
15
16
17
18
19
static void armpmu_init(struct arm_pmu *armpmu)
{
atomic_set(&armpmu->active_events, 0);
mutex_init(&armpmu->reserve_mutex);

/* (2.1) 标准pmu的初始赋值 */
armpmu->pmu = (struct pmu) {
.pmu_enable = armpmu_enable,
.pmu_disable = armpmu_disable,
.event_init = armpmu_event_init,
.add = armpmu_add,
.del = armpmu_del,
.start = armpmu_start,
.stop = armpmu_stop,
.read = armpmu_read,
.filter_match = armpmu_filter_match,
.events_across_hotplug = 1,
};
}

cpu_pmu_init()初始化arm_pmu结构的通用部分:

1
2
3
4
5
6
7
8
9
10
11
12
13
14
15
16
17
18
19
20
21
22
23
24
25
26
27
28
29
30
31
32
33
34
35
36
37
38
39
40
41
42
43
44
45
46
47
48
49
50
51
52
53
54
55
56
57
static int cpu_pmu_init(struct arm_pmu *cpu_pmu)
{
int err;
int cpu;
struct pmu_hw_events __percpu *cpu_hw_events;

/* (3.1) 分配per_cpu的pmu_hw_events结构
hw pmu在每个cpu上有7个hw counter,
pmu_hw_events->used_mask中的每个bit代表对于counter是否被使用
cpu_hw_events->events[]代表被使用counter对应的perf_event结构
*/
cpu_hw_events = alloc_percpu(struct pmu_hw_events);
if (!cpu_hw_events)
return -ENOMEM;

/* (3.2) 注册arm_pmu对应的cpu hotplug回调 */
cpu_pmu->hotplug_nb.notifier_call = cpu_pmu_notify;
err = register_cpu_notifier(&cpu_pmu->hotplug_nb);
if (err)
goto out_hw_events;

/* (3.3) 注册arm_pmu对应的pm回调 */
err = cpu_pm_pmu_register(cpu_pmu);
if (err)
goto out_unregister;

/* (3.4) 初始化分配的pmu_hw_events结构 */
for_each_possible_cpu(cpu) {
struct pmu_hw_events *events = per_cpu_ptr(cpu_hw_events, cpu);
raw_spin_lock_init(&events->pmu_lock);
events->percpu_pmu = cpu_pmu;
}

/* (3.5) 初始化arm_pmu的部分成员 */
cpu_pmu->hw_events = cpu_hw_events;
cpu_pmu->request_irq = cpu_pmu_request_irq;
cpu_pmu->free_irq = cpu_pmu_free_irq;

/* Ensure the PMU has sane values out of reset. */
/* (3.6) 如果可能reset到确定值 */
if (cpu_pmu->reset)
on_each_cpu_mask(&cpu_pmu->supported_cpus, cpu_pmu->reset,
cpu_pmu, 1);

/* If no interrupts available, set the corresponding capability flag */
/* (3.7) 如果没有中断能力,不能上报sample数据 */
if (!platform_get_irq(cpu_pmu->plat_device, 0))
cpu_pmu->pmu.capabilities |= PERF_PMU_CAP_NO_INTERRUPT;

return 0;

out_unregister:
unregister_cpu_notifier(&cpu_pmu->hotplug_nb);
out_hw_events:
free_percpu(cpu_hw_events);
return err;
}

armv8_pmuv3_init()初始化arm_pmu结构的架构(arm64)相关部分:

1
2
3
4
5
6
7
8
9
10
11
12
13
14
15
16
17
18
19
20
21
22
23
24
25
26
27
28
29
30
31
32
33
34
35
36
37
38
39
40
41
42
43
44
45
46
47
48
49
50
51
52
53
54
55
56
57
58
59
60
61
62
63
64
65
66
67
68
69
70
static int armv8_pmuv3_init(struct arm_pmu *cpu_pmu)
{
/* (4.1) arm_pmu结构中架构相关的成员赋值 */
armv8_pmu_init(cpu_pmu);
cpu_pmu->name = "armv8_pmuv3";
cpu_pmu->map_event = armv8_pmuv3_map_event;

/* (4.2) 重要:
返回pmu可配置counter的个数
*/
return armv8pmu_probe_num_events(cpu_pmu);
}

|→

void armv8_pmu_init(struct arm_pmu *cpu_pmu)
{
cpu_pmu->handle_irq = armv8pmu_handle_irq,
cpu_pmu->enable = armv8pmu_enable_event,
cpu_pmu->disable = armv8pmu_disable_event,
cpu_pmu->read_counter = armv8pmu_read_counter,
cpu_pmu->write_counter = armv8pmu_write_counter,
cpu_pmu->get_event_idx = armv8pmu_get_event_idx,
cpu_pmu->start = armv8pmu_start,
cpu_pmu->stop = armv8pmu_stop,
cpu_pmu->reset = armv8pmu_reset,
cpu_pmu->max_period = (1LLU << 32) - 1,
cpu_pmu->set_event_filter = armv8pmu_set_event_filter;
}

|→

int armv8pmu_probe_num_events(struct arm_pmu *arm_pmu)
{
int ret;
struct arm_pmu_and_idle_nb *pmu_idle_nb;

pmu_idle_nb = devm_kzalloc(&arm_pmu->plat_device->dev,
sizeof(*pmu_idle_nb), GFP_KERNEL);
if (!pmu_idle_nb)
return -ENOMEM;

pmu_idle_nb->cpu_pmu = arm_pmu;
pmu_idle_nb->perf_cpu_idle_nb.notifier_call = perf_cpu_idle_notifier;
idle_notifier_register(&pmu_idle_nb->perf_cpu_idle_nb);

ret = smp_call_function_any(&arm_pmu->supported_cpus,
armv8pmu_read_num_pmnc_events,
&arm_pmu->num_events, 1);
if (ret)
idle_notifier_unregister(&pmu_idle_nb->perf_cpu_idle_nb);
return ret;


}

||→

static void armv8pmu_read_num_pmnc_events(void *info)
{
int *nb_cnt = info;

/* (4.2.1) 读寄存器,返回counter的个数 */
/* Read the nb of CNTx counters supported from PMNC */
*nb_cnt = (armv8pmu_pmcr_read() >> ARMV8_PMCR_N_SHIFT) & ARMV8_PMCR_N_MASK;

/* (4.2.2) counter 0,固定为cpu cycles counter */
/* Add the CPU cycles counter */
*nb_cnt += 1;
}

2、event init

我们深入来看看标准pmu的event init函数:

1
2
3
4
5
6
7
8
9
10
11
12
13
14
15
16
17
18
19
20
21
22
23
24
25
26
27
28
29
30
31
32
33
34
35
36
37
38
39
40
41
42
43
44
45
46
47
48
49
50
51
52
53
54
55
56
57
58
59
60
61
62
63
64
65
66
67
68
69
70
71
72
73
74
75
76
77
78
79
80
81
82
83
84
85
86
87
88
89
90
91
92
93
94
95
96
97
98
99
100
101
102
103
104
105
106
107
108
109
110
111
112
113
114
115
116
117
118
119
120
121
122
123
124
125
126
127
128
129
130
131
132
133
134
135
136
137
138
139
140
141
142
143
144
145
146
147
148
149
150
151
152
153
154
155
156
157
158
159
160
161
162
163
164
165
166
167
168
169
170
171
172
173
174
175
176
177
178
179
180
181
182
183
184
185
186
187
188
189
190
191
192
193
194
195
196
197
198
199
200
201
202
203
204
205
206
207
208
209
210
211
212
213
214
215
216
217
218
219
220
221
222
223
224
225
226
227
228
229
230
231
232
233
234
235
236
237
238
239
240
241
242
243
244
245
246
247
248
249
250
251
252
253
254
255
256
257
258
259
260
261
262
263
264
265
266
267
268
269
270
271
272
273
274
275
276
277
278
static void armpmu_init(struct arm_pmu *armpmu)
{
atomic_set(&armpmu->active_events, 0);
mutex_init(&armpmu->reserve_mutex);

armpmu->pmu = (struct pmu) {
.pmu_enable = armpmu_enable,
.pmu_disable = armpmu_disable,
.event_init = armpmu_event_init,
.add = armpmu_add,
.del = armpmu_del,
.start = armpmu_start,
.stop = armpmu_stop,
.read = armpmu_read,
.filter_match = armpmu_filter_match,
.events_across_hotplug = 1,
};
}


static int armpmu_event_init(struct perf_event *event)
{
struct arm_pmu *armpmu = to_arm_pmu(event->pmu);
int err = 0;
atomic_t *active_events = &armpmu->active_events;

/*
* Reject CPU-affine events for CPUs that are of a different class to
* that which this PMU handles. Process-following events (where
* event->cpu == -1) can be migrated between CPUs, and thus we have to
* reject them later (in armpmu_add) if they're scheduled on a
* different class of CPU.
*/
/* (1) 判断event所绑定的cpu是否支持 */
if (event->cpu != -1 &&
!cpumask_test_cpu(event->cpu, &armpmu->supported_cpus))
return -ENOENT;

/* does not support taken branch sampling */
if (has_branch_stack(event))
return -EOPNOTSUPP;

/* (2) 将event的type + config,映射成:PERF_TYPE_HARDWARE/PERF_TYPE_HW_CACHE/PERF_TYPE_RAW
调用的是armv8_pmuv3_map_event()函数
*/
if (armpmu->map_event(event) == -ENOENT)
return -ENOENT;

event->destroy = hw_perf_event_destroy;

/* (3) 如果是event第一次绑定pmu,需要做一些初始化动作:
比如注册中断
*/
if (!atomic_inc_not_zero(active_events)) {
mutex_lock(&armpmu->reserve_mutex);
if (atomic_read(active_events) == 0)
err = armpmu_reserve_hardware(armpmu);

if (!err)
atomic_inc(active_events);
mutex_unlock(&armpmu->reserve_mutex);
}

if (err)
return err;

/* (4) perf_event的一些初始化 */
err = __hw_perf_event_init(event);
if (err)
hw_perf_event_destroy(event);

return err;
}

|→

static int armv8_pmuv3_map_event(struct perf_event *event)
{
return armpmu_map_event(event, &armv8_pmuv3_perf_map,
&armv8_pmuv3_perf_cache_map,
ARMV8_EVTYPE_EVENT);
}

||→

int
armpmu_map_event(struct perf_event *event,
const unsigned (*event_map)[PERF_COUNT_HW_MAX],
const unsigned (*cache_map)
[PERF_COUNT_HW_CACHE_MAX]
[PERF_COUNT_HW_CACHE_OP_MAX]
[PERF_COUNT_HW_CACHE_RESULT_MAX],
u32 raw_event_mask)
{
u64 config = event->attr.config;
int type = event->attr.type;

/* (2.1) hardware pmu在perf_pmu_register()注册的时候,type=-1,所有它的type是动态分配的
如果event的type = 动态分配的type,那么config就是raw类型的,不用映射,直接指定hardware counter的type
*/
if (type == event->pmu->type)
return armpmu_map_raw_event(raw_event_mask, config);

switch (type) {

/* (2.2) HARDWARE type,对config进行映射转换 */
case PERF_TYPE_HARDWARE:
return armpmu_map_hw_event(event_map, config);

/* (2.3) HW_CACHE type,对config进行映射转换 */
case PERF_TYPE_HW_CACHE:
return armpmu_map_cache_event(cache_map, config);

/* (2.4) RAW type,对config进行映射转换 */
case PERF_TYPE_RAW:
return armpmu_map_raw_event(raw_event_mask, config);
}

return -ENOENT;
}

|→

static int
armpmu_reserve_hardware(struct arm_pmu *armpmu)
{
/* (3.1) 实际调用的是cpu_pmu_request_irq()函数 */
int err = armpmu->request_irq(armpmu, armpmu_dispatch_irq);
if (err) {
armpmu_release_hardware(armpmu);
return err;
}

armpmu->pmu_state = ARM_PMU_STATE_RUNNING;

return 0;
}

||→

static int cpu_pmu_request_irq(struct arm_pmu *cpu_pmu, irq_handler_t handler)
{
int i, err, irq, irqs;
struct platform_device *pmu_device = cpu_pmu->plat_device;
struct pmu_hw_events __percpu *hw_events = cpu_pmu->hw_events;

if (!pmu_device)
return -ENODEV;

/* (3.1.1) pmu支持中断的个数 */
irqs = min(pmu_device->num_resources, num_possible_cpus());
if (irqs < 1) {
pr_warn_once("perf/ARM: No irqs for PMU defined, sampling events not supported\n");
return 0;
}

/* (3.1.2) 如果是per_cpu中断,从dts获得中断号并注册 */
irq = platform_get_irq(pmu_device, 0);
if (irq > 0 && irq_is_percpu(irq)) {
err = request_percpu_irq(irq, handler, "arm-pmu",
&hw_events->percpu_pmu);
if (err) {
pr_err("unable to request IRQ%d for ARM PMU counters\n",
irq);
return err;
}
on_each_cpu(cpu_pmu_enable_percpu_irq, &irq, 1);
cpu_pmu->percpu_irq = irq;
/* (3.1.3) 如果不是per_cpu中断,逐个从dts获得中断号并注册 */
} else {
for (i = 0; i < irqs; ++i) {
int cpu = i;

err = 0;
irq = platform_get_irq(pmu_device, i);
if (irq < 0)
continue;

if (cpu_pmu->irq_affinity)
cpu = cpu_pmu->irq_affinity[i];

/*
* If we have a single PMU interrupt that we can't shift,
* assume that we're running on a uniprocessor machine and
* continue. Otherwise, continue without this interrupt.
*/
if (irq_set_affinity(irq, cpumask_of(cpu)) && irqs > 1) {
pr_warn("unable to set irq affinity (irq=%d, cpu=%u)\n",
irq, cpu);
continue;
}

err = request_irq(irq, handler,
IRQF_NOBALANCING | IRQF_NO_THREAD, "arm-pmu",
per_cpu_ptr(&hw_events->percpu_pmu, cpu));
if (err) {
pr_err("unable to request IRQ%d for ARM PMU counters\n",
irq);
return err;
}

cpumask_set_cpu(cpu, &cpu_pmu->active_irqs);
}
}

return 0;
}

|→

static int
__hw_perf_event_init(struct perf_event *event)
{
struct arm_pmu *armpmu = to_arm_pmu(event->pmu);
struct hw_perf_event *hwc = &event->hw;
int mapping;

/* (4.1) 再次调用映射转换,把config转换成counter的type
并且存储到hwc->config_base变量中
*/
mapping = armpmu->map_event(event);

if (mapping < 0) {
pr_debug("event %x:%llx not supported\n", event->attr.type,
event->attr.config);
return mapping;
}

/*
* We don't assign an index until we actually place the event onto
* hardware. Use -1 to signify that we haven't decided where to put it
* yet. For SMP systems, each core has it's own PMU so we can't do any
* clever allocation or constraints checking at this point.
*/
hwc->idx = -1;
hwc->config_base = 0;
hwc->config = 0;
hwc->event_base = 0;

/*
* Check whether we need to exclude the counter from certain modes.
*/
if ((!armpmu->set_event_filter ||
armpmu->set_event_filter(hwc, &event->attr)) &&
event_requires_mode_exclusion(&event->attr)) {
pr_debug("ARM performance counters do not support "
"mode exclusion\n");
return -EOPNOTSUPP;
}

/*
* Store the event encoding into the config_base field.
*/
hwc->config_base |= (unsigned long)mapping;

/* (4.2) 如果不需要提供sample数据,
初始化period参数:sample_period、last_period、period_left
*/
if (!is_sampling_event(event)) {
/*
* For non-sampling runs, limit the sample_period to half
* of the counter width. That way, the new counter value
* is far less likely to overtake the previous one unless
* you have some serious IRQ latency issues.
*/
hwc->sample_period = armpmu->max_period >> 1;
hwc->last_period = hwc->sample_period;
local64_set(&hwc->period_left, hwc->sample_period);
}

if (event->group_leader != event) {
if (validate_group(event) != 0)
return -EINVAL;
}

return 0;
}

3、event add/del

在“perf_event内核框架”一章中已经阐明,task维度的perf_event需要和task一起调度,其回调函数最后控制的就是perf_event的启动和停止。

  • start函数调用路径:context_switch() -> finish_task_switch() -> perf_event_task_sched_in() -> __perf_event_task_sched_in() -> perf_event_context_sched_in() -> perf_event_sched_in() -> ctx_sched_in() -> ctx_pinned_sched_in()/ctx_flexible_sched_in() -> group_sched_in() -> event_sched_in() -> pmu->add(event, PERF_EF_START) -> xxx_add():
  • stop函数调用路径:context_switch() -> prepare_task_switch() -> perf_event_task_sched_out() -> __perf_event_task_sched_out() -> perf_event_context_sched_out() -> ctx_sched_out() -> group_sched_out() -> event_sched_out() -> pmu->del() -> xxx_del():

可以看到hw counter是非常珍贵的,arm64一个cpu上只有7个counter,而一个perf_event在一个cpu上运行时就需要消耗一个独立的hw counter。不像软件的pmu,多个perf_event可以以链表的形式无限的链接到同一个pmu数据源的per_cpu链表上。

我们具体看看hardware pmu的add和del函数的实现:

  • armpmu_add()。从本cpu的counters中分配空闲的counter,配置成perf_event指定的type,并且配置count指定多少count后中断,最后使能counter。
1
2
3
4
5
6
7
8
9
10
11
12
13
14
15
16
17
18
19
20
21
22
23
24
25
26
27
28
29
30
31
32
33
34
35
36
37
38
39
40
41
42
43
44
45
46
47
48
49
50
51
52
53
54
55
56
57
58
59
60
61
62
63
64
65
66
67
68
69
70
71
72
73
74
75
76
77
78
79
80
81
82
83
84
85
86
87
88
89
90
91
92
93
94
95
96
97
98
99
100
101
102
103
104
105
106
107
108
109
110
111
112
113
114
115
116
117
118
119
120
121
122
123
124
125
126
127
128
129
130
131
132
133
134
135
136
137
138
139
140
141
142
143
144
145
146
147
148
149
150
151
152
153
154
155
156
157
158
159
160
161
162
163
164
165
166
167
168
169
170
171
172
173
174
175
176
177
178
179
180
181
182
183
184
185
186
187
188
189
190
191
192
193
194
195
196
197
198
199
200
201
202
203
204
205
206
207
208
209
210
211
212
213
214
215
216
217
218
219
220
221
222
223
224
225
226
227
228
229
230
231
232
233
234
235
236
237
238
239
240
241
242
243
244
245
246
247
248
249
250
251
252
253
254
255
256
257
258
259
260
261
262
263
264
265
266
267
268
269
270
271
272
273
274
275
276
277
278
279
280
281
282
283
284
285
286
287
288
289
290
291
292
293
294
295
296
297
298
299
300
301
302
303
304
305
static int
armpmu_add(struct perf_event *event, int flags)
{
struct arm_pmu *armpmu = to_arm_pmu(event->pmu);
struct pmu_hw_events *hw_events = this_cpu_ptr(armpmu->hw_events);
struct hw_perf_event *hwc = &event->hw;
int idx;
int err = 0;

/* An event following a process won't be stopped earlier */
if (!cpumask_test_cpu(smp_processor_id(), &armpmu->supported_cpus))
return -ENOENT;

/* (1) disable本cpu上所有的counter */
perf_pmu_disable(event->pmu);

/* If we don't have a space for the counter then finish early. */
/* (2) 从本cpu上获取一个空闲的counter */
idx = armpmu->get_event_idx(hw_events, event);
if (idx < 0) {
err = idx;
goto out;
}

/*
* If there is an event in the counter we are going to use then make
* sure it is disabled.
*/
event->hw.idx = idx;
armpmu->disable(event);
hw_events->events[idx] = event;

hwc->state = PERF_HES_STOPPED | PERF_HES_UPTODATE;
/* (3) 使能新分配的counter:
把counter配置成perf_event需要的type
并且配置period count,到期后会产生中断,在中断中上报数据并且重新配置period count
*/
if (flags & PERF_EF_START)
armpmu_start(event, PERF_EF_RELOAD);

/* Propagate our changes to the userspace mapping. */
perf_event_update_userpage(event);

out:
/* (4) 重新使能本cpu上所有的counter */
perf_pmu_enable(event->pmu);
return err;
}

|→

void perf_pmu_disable(struct pmu *pmu)
{
int *count = this_cpu_ptr(pmu->pmu_disable_count);
if (!(*count)++)
/* 调用armpmu_disable() */
pmu->pmu_disable(pmu);
}

||→

static void armpmu_disable(struct pmu *pmu)
{
struct arm_pmu *armpmu = to_arm_pmu(pmu);

/* For task-bound events we may be called on other CPUs */
if (!cpumask_test_cpu(smp_processor_id(), &armpmu->supported_cpus))
return;

/* 调用armv8pmu_stop() */
armpmu->stop(armpmu);
}

|||→

static void armv8pmu_stop(struct arm_pmu *cpu_pmu)
{
unsigned long flags;
struct pmu_hw_events *events = this_cpu_ptr(cpu_pmu->hw_events);

raw_spin_lock_irqsave(&events->pmu_lock, flags);
/* Disable all counters */
/* (1.1) disable本cpu上所有的counter */
armv8pmu_pmcr_write(armv8pmu_pmcr_read() & ~ARMV8_PMCR_E);
raw_spin_unlock_irqrestore(&events->pmu_lock, flags);
}

|→

static int armv8pmu_get_event_idx(struct pmu_hw_events *cpuc,
struct perf_event *event)
{
int idx;
struct arm_pmu *cpu_pmu = to_arm_pmu(event->pmu);
struct hw_perf_event *hwc = &event->hw;
unsigned long evtype = hwc->config_base & ARMV8_EVTYPE_EVENT;

/* Place the first cycle counter request into the cycle counter. */
/* (2.1) 如果需要cycles counter,先尝试counter 0 */
if (evtype == ARMV8_PMUV3_PERFCTR_CLOCK_CYCLES) {
if (!test_and_set_bit(ARMV8_IDX_CYCLE_COUNTER, cpuc->used_mask))
return ARMV8_IDX_CYCLE_COUNTER;
}

/*
* For anything other than a cycle counter, try and use
* the events counters
*/
/* (2.2) 否则从counter 1开始寻找空闲counter */
for (idx = ARMV8_IDX_COUNTER0; idx < cpu_pmu->num_events; ++idx) {
if (!test_and_set_bit(idx, cpuc->used_mask))
return idx;
}

/* The counters are all in use. */
return -EAGAIN;
}

|→

static void armpmu_start(struct perf_event *event, int flags)
{
struct arm_pmu *armpmu = to_arm_pmu(event->pmu);
struct hw_perf_event *hwc = &event->hw;

/*
* ARM pmu always has to reprogram the period, so ignore
* PERF_EF_RELOAD, see the comment below.
*/
if (flags & PERF_EF_RELOAD)
WARN_ON_ONCE(!(hwc->state & PERF_HES_UPTODATE));

hwc->state = 0;
/*
* Set the period again. Some counters can't be stopped, so when we
* were stopped we simply disabled the IRQ source and the counter
* may have been left counting. If we don't do this step then we may
* get an interrupt too soon or *way* too late if the overflow has
* happened since disabling.
*/
/* (3.1) 设置counter的中断次数 */
armpmu_event_set_period(event);

/* (3.2) 配置counter type,并且使能counter */
armpmu->enable(event);
}

||→

int armpmu_event_set_period(struct perf_event *event)
{
struct arm_pmu *armpmu = to_arm_pmu(event->pmu);
struct hw_perf_event *hwc = &event->hw;
s64 left = local64_read(&hwc->period_left);
s64 period = hwc->sample_period;
int ret = 0;

/* (3.1.1) left初始值为period,中断后:left -= delta ,
如果上次实际发生中断的间隔delta准确等于period,left=0
如果上次实际发生中断的间隔delta准确大于period,left<0
如果上次实际发生中断的间隔delta准确大于2period,left <= -period,这种情况下没有补差的必要直接重新对其period
*/
if (unlikely(left <= -period)) {
left = period;
local64_set(&hwc->period_left, left);
hwc->last_period = period;
ret = 1;
}

/* (3.1.2) 如果上次实际发生中断的间隔delta准确等于period,left=0
如果上次实际发生中断的间隔delta准确大于period,left<0
如果上次实际发生中断的间隔delta准确大于2period,left <= -period
如果上次实际发生中断的间隔delta准确大于period但是小于2period,尝试重新补差同步,
*/
if (unlikely(left <= 0)) {
left += period;
local64_set(&hwc->period_left, left);
hwc->last_period = period;
ret = 1;
}

/*
* Limit the maximum period to prevent the counter value
* from overtaking the one we are about to program. In
* effect we are reducing max_period to account for
* interrupt latency (and we are being very conservative).
*/
/* (3.1.3) left不能大于最大周期的1/2 */
if (left > (armpmu->max_period >> 1))
left = armpmu->max_period >> 1;

/* (3.1.4) 配置prev_count为-left */
local64_set(&hwc->prev_count, (u64)-left);

/* (3.1.5) 配置counter为-left
当counter累加到0后产生中断
*/
armpmu->write_counter(event, (u64)(-left) & 0xffffffff);

perf_event_update_userpage(event);

return ret;
}

|||→

static inline void armv8pmu_write_counter(struct perf_event *event, u32 value)
{
struct arm_pmu *cpu_pmu = to_arm_pmu(event->pmu);
struct hw_perf_event *hwc = &event->hw;
int idx = hwc->idx;

if (!armv8pmu_counter_valid(cpu_pmu, idx))
pr_err("CPU%u writing wrong counter %d\n",
smp_processor_id(), idx);
/* (3.1.5.1) 默认就是counter 0,直接配置count */
else if (idx == ARMV8_IDX_CYCLE_COUNTER)
armv8pmu_pmccntr_write_reg(value);

/* (3.1.5.2) 否则需要先选择counter编号,再配置count */
else if (armv8pmu_select_counter(idx) == idx)
armv8pmu_pmxevcntr_write_reg(value);
}

||→

static void armv8pmu_enable_event(struct perf_event *event)
{
unsigned long flags;
struct hw_perf_event *hwc = &event->hw;
struct arm_pmu *cpu_pmu = to_arm_pmu(event->pmu);
struct pmu_hw_events *events = this_cpu_ptr(cpu_pmu->hw_events);
int idx = hwc->idx;

/*
* Enable counter and interrupt, and set the counter to count
* the event that we're interested in.
*/
raw_spin_lock_irqsave(&events->pmu_lock, flags);

/*
* Disable counter
*/
/* (3.2.1) disable counter */
armv8pmu_disable_counter(idx);

/*
* Set event (if destined for PMNx counters).
*/
/* (3.2.2) 根据perf_event映射转换的type,配置counter的type */
armv8pmu_write_evtype(idx, hwc->config_base);

/*
* Enable interrupt for this counter
*/
/* (3.2.3) enable counter的中断 */
armv8pmu_enable_intens(idx);

/*
* Enable counter
*/
/* (3.2.4) enable counter */
armv8pmu_enable_counter(idx);

raw_spin_unlock_irqrestore(&events->pmu_lock, flags);
}

|→

void perf_pmu_enable(struct pmu *pmu)
{
int *count = this_cpu_ptr(pmu->pmu_disable_count);
if (!--(*count))
pmu->pmu_enable(pmu);
}

||→

static void armpmu_enable(struct pmu *pmu)
{
struct arm_pmu *armpmu = to_arm_pmu(pmu);
struct pmu_hw_events *hw_events = this_cpu_ptr(armpmu->hw_events);
int enabled = bitmap_weight(hw_events->used_mask, armpmu->num_events);

/* For task-bound events we may be called on other CPUs */
if (!cpumask_test_cpu(smp_processor_id(), &armpmu->supported_cpus))
return;

if (enabled)
armpmu->start(armpmu);
}

|||→

static void armv8pmu_start(struct arm_pmu *cpu_pmu)
{
unsigned long flags;
struct pmu_hw_events *events = this_cpu_ptr(cpu_pmu->hw_events);

raw_spin_lock_irqsave(&events->pmu_lock, flags);
/* Enable all counters */
/* (4.1) 重新使能本cpu上所有的counter */
armv8pmu_pmcr_write(armv8pmu_pmcr_read() | ARMV8_PMCR_E);
raw_spin_unlock_irqrestore(&events->pmu_lock, flags);
}
  • armpmu_del()。将event对应的counter停工,并且将counter归还给本cpu的空闲counter。
1
2
3
4
5
6
7
8
9
10
11
12
13
14
15
16
17
18
19
static void
armpmu_del(struct perf_event *event, int flags)
{
struct arm_pmu *armpmu = to_arm_pmu(event->pmu);
struct pmu_hw_events *hw_events = this_cpu_ptr(armpmu->hw_events);
struct hw_perf_event *hwc = &event->hw;
int idx = hwc->idx;

/* (1) 将event对应的counter停工 */
armpmu_stop(event, PERF_EF_UPDATE);

/* (2) 将counter归还给本cpu的空闲counter */
hw_events->events[idx] = NULL;
clear_bit(idx, hw_events->used_mask);
if (armpmu->clear_event_idx)
armpmu->clear_event_idx(hw_events, event);

perf_event_update_userpage(event);
}

4、event 数据采集

perf_k_pmu_hw_irq

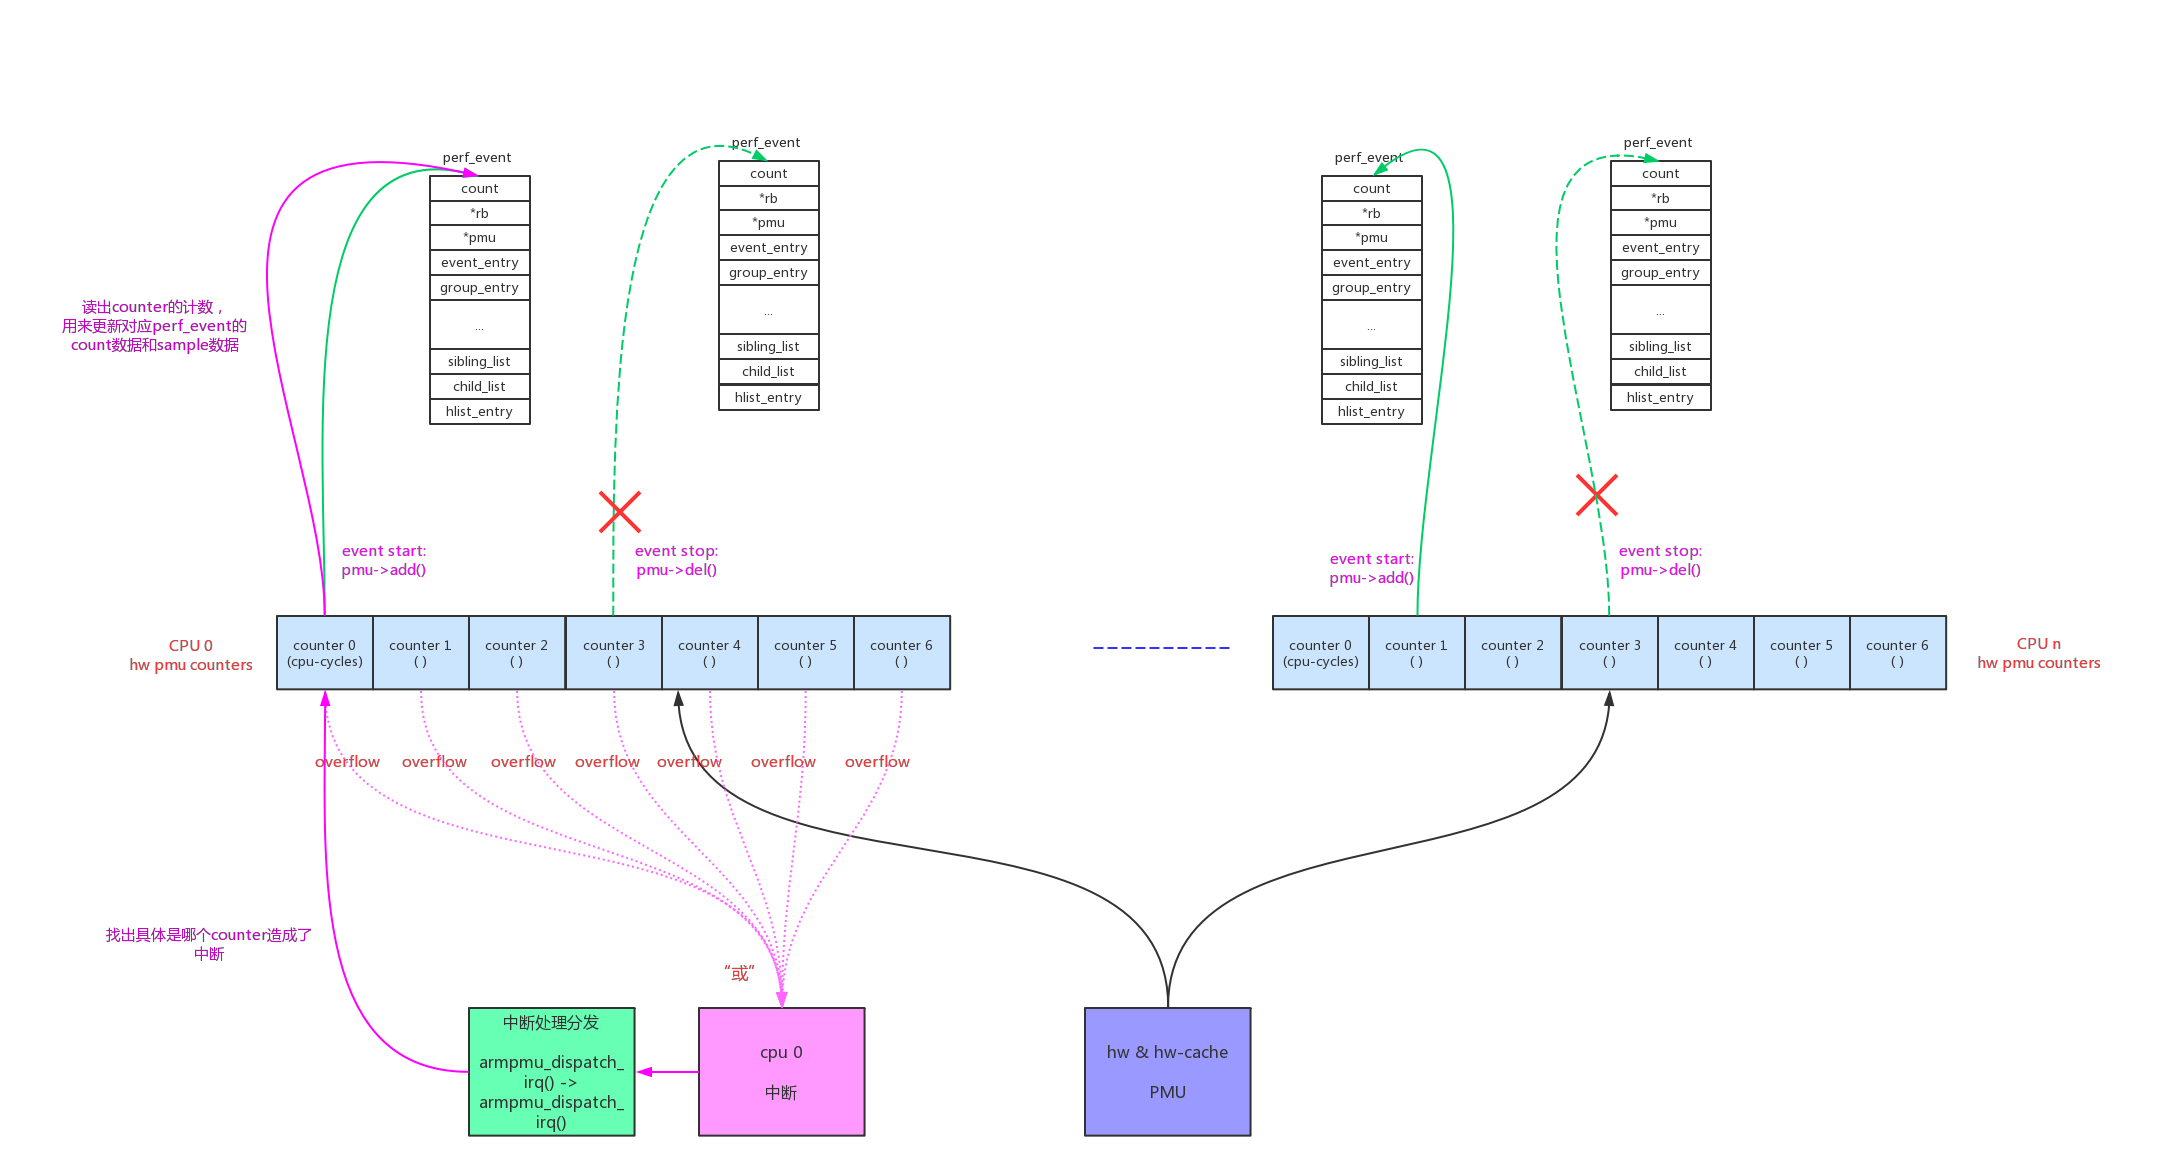
hardware event是采样法,采样法都是依赖于中断实现的:

  • 配置counter的count,当count累加到0后,产生中断
  • arm64每个cpu上多个counter共享一个中断,所以中断处理函数中需要分发中断,查看到底是哪一个counter发生了overflow
  • 如果是某个counter发出的中断,给其对应的perf_event上报count数据和sample数据
  • 处理完所以事务后,重新配置counter的count,这样就会重复的产生周期性的采样

具体的中断处理函数如下:

1
2
3
4
5
6
7
8
9
10
11
12
13
14
15
16
17
18
19
20
21
22
23
24
25
26
27
28
29
30
31
32
33
34
35
36
37
38
39
40
41
42
43
44
45
46
47
48
49
50
51
52
53
54
55
56
57
58
59
60
61
62
63
64
65
66
67
68
69
70
71
72
73
74
75
76
77
78
79
80
81
82
83
84
85
86
87
88
89
90
91
92
93
94
95
96
97
98
99
100
101
102
103
104
105
106
107
108
109
110
111
112
113
114
115
116
117
118
119
120
121
122
123
124
125
126
127
128
129
130
131
132
133
static irqreturn_t armpmu_dispatch_irq(int irq, void *dev)
{
struct arm_pmu *armpmu;
struct platform_device *plat_device;
struct arm_pmu_platdata *plat;
int ret;
u64 start_clock, finish_clock;

/*
* we request the IRQ with a (possibly percpu) struct arm_pmu**, but
* the handlers expect a struct arm_pmu*. The percpu_irq framework will
* do any necessary shifting, we just need to perform the first
* dereference.
*/
armpmu = *(void **)dev;
plat_device = armpmu->plat_device;
plat = dev_get_platdata(&plat_device->dev);

start_clock = sched_clock();
if (plat && plat->handle_irq)
ret = plat->handle_irq(irq, armpmu, armpmu->handle_irq);
else
/* (1) 实际调用了armv8pmu_handle_irq() */
ret = armpmu->handle_irq(irq, armpmu);
finish_clock = sched_clock();

perf_sample_event_took(finish_clock - start_clock);
return ret;
}

|→

static irqreturn_t armv8pmu_handle_irq(int irq_num, void *dev)
{
u32 pmovsr;
struct perf_sample_data data;
struct arm_pmu *cpu_pmu = (struct arm_pmu *)dev;
struct pmu_hw_events *cpuc = this_cpu_ptr(cpu_pmu->hw_events);
struct pt_regs *regs;
int idx;

/*
* Get and reset the IRQ flags
*/
pmovsr = armv8pmu_getreset_flags();

/*
* Did an overflow occur?
*/
if (!armv8pmu_has_overflowed(pmovsr))
return IRQ_NONE;

/*
* Handle the counter(s) overflow(s)
*/
regs = get_irq_regs();

/* (1.1) 逐个轮询,是本cpu上的哪个counter产生的中断 */
for (idx = 0; idx < cpu_pmu->num_events; ++idx) {
struct perf_event *event = cpuc->events[idx];
struct hw_perf_event *hwc;

/* Ignore if we don't have an event. */
if (!event)
continue;

/*
* We have a single interrupt for all counters. Check that
* each counter has overflowed before we process it.
*/
/* (1.1.1) 判断是否当前counter产生的中断 */
if (!armv8pmu_counter_has_overflowed(pmovsr, idx))
continue;

hwc = &event->hw;

/* (1.1.2) 计算counter的差值,并且更新perf_event的count值 */
armpmu_event_update(event);


perf_sample_data_init(&data, 0, hwc->last_period);

/* (1.1.3) 重新配置中断周期 */
if (!armpmu_event_set_period(event))
continue;

/* (1.1.4) 给对应perf_event上报sample数据 */
if (perf_event_overflow(event, &data, regs))
cpu_pmu->disable(event);
}

/*
* Handle the pending perf events.
*
* Note: this call *must* be run with interrupts disabled. For
* platforms that can have the PMU interrupts raised as an NMI, this
* will not work.
*/
/* (1.2) 处理irq_work_queue()压入的任务 */
irq_work_run();

return IRQ_HANDLED;
}

||→

u64 armpmu_event_update(struct perf_event *event)
{
struct arm_pmu *armpmu = to_arm_pmu(event->pmu);
struct hw_perf_event *hwc = &event->hw;
u64 delta, prev_raw_count, new_raw_count;

again:
prev_raw_count = local64_read(&hwc->prev_count);

/* (1.1.2.1) 读取counter的当前count值 */
new_raw_count = armpmu->read_counter(event);

if (local64_cmpxchg(&hwc->prev_count, prev_raw_count,
new_raw_count) != prev_raw_count)
goto again;

/* (1.1.2.2) 计算和上一次的差值 */
delta = (new_raw_count - prev_raw_count) & armpmu->max_period;

/* (1.1.2.3) 把差值更新到perf_event的count中 */
local64_add(delta, &event->count);

/* (1.1.2.4) 把差值更新到left中 */
local64_sub(delta, &hwc->period_left);

return new_raw_count;
}

4.1、count数据

perf_event的count数据,除了在上一节的中断中更新,在read操作读取时也会更新最新的count。

perf_read() -> perf_read() -> perf_read_one() -> perf_event_read_value() -> perf_event_read() -> perf_event_read():

1
2
3
4
5
6
7
8
9
10
11
12
13
14
15
16
17
18
19
20
21
22
23
24
25
26
27
28
29
30
31
32
33
34
35
36
37
38
39
40
41
42
43
44
45
46
47
48
49
50
51
52
53
54
55
56
57
58
59
60
61
62
63
64
65
66
67
68
69
70
71
72
73
74
75
76
77
78
79
80
81
82
83
84
85
86
87
88
89
static void __perf_event_read(void *info)
{
struct perf_read_data *data = info;
struct perf_event *sub, *event = data->event;
struct perf_event_context *ctx = event->ctx;
struct perf_cpu_context *cpuctx = __get_cpu_context(ctx);
struct pmu *pmu = event->pmu;

/*
* If this is a task context, we need to check whether it is
* the current task context of this cpu. If not it has been
* scheduled out before the smp call arrived. In that case
* event->count would have been updated to a recent sample
* when the event was scheduled out.
*/
if (ctx->task && cpuctx->task_ctx != ctx)
return;

raw_spin_lock(&ctx->lock);
if (ctx->is_active) {
update_context_time(ctx);
update_cgrp_time_from_event(event);
}

update_event_times(event);
if (event->state != PERF_EVENT_STATE_ACTIVE)
goto unlock;

if (!data->group) {
/* (1) 调用pmu->read()函数更新最新的count值
如果是hardware pmu实际调用到armpmu_read()
*/
pmu->read(event);
data->ret = 0;
goto unlock;
}

pmu->start_txn(pmu, PERF_PMU_TXN_READ);

pmu->read(event);

list_for_each_entry(sub, &event->sibling_list, group_entry) {
update_event_times(sub);
if (sub->state == PERF_EVENT_STATE_ACTIVE) {
/*
* Use sibling's PMU rather than @event's since
* sibling could be on different (eg: software) PMU.
*/
sub->pmu->read(sub);
}
}

data->ret = pmu->commit_txn(pmu);

unlock:
raw_spin_unlock(&ctx->lock);
}


static void
armpmu_read(struct perf_event *event)
{
armpmu_event_update(event);
}


u64 armpmu_event_update(struct perf_event *event)
{
struct arm_pmu *armpmu = to_arm_pmu(event->pmu);
struct hw_perf_event *hwc = &event->hw;
u64 delta, prev_raw_count, new_raw_count;

again:
prev_raw_count = local64_read(&hwc->prev_count);
new_raw_count = armpmu->read_counter(event);

if (local64_cmpxchg(&hwc->prev_count, prev_raw_count,
new_raw_count) != prev_raw_count)
goto again;

delta = (new_raw_count - prev_raw_count) & armpmu->max_period;

local64_add(delta, &event->count);
local64_sub(delta, &hwc->period_left);

return new_raw_count;
}

4.2、sample数据

在中断中定期的上报sample数据:

1
2
3
4
5
6
7
8
9
10
11
12
13
14
15
16
17
18
19
20
21
22
23
24
25
26
27
28
29
30
31
32
33
34
35
36
37
38
39
static irqreturn_t armv8pmu_handle_irq(int irq_num, void *dev)
{


for (idx = 0; idx < cpu_pmu->num_events; ++idx) {
struct perf_event *event = cpuc->events[idx];
struct hw_perf_event *hwc;

/* Ignore if we don't have an event. */
if (!event)
continue;

/*
* We have a single interrupt for all counters. Check that
* each counter has overflowed before we process it.
*/
if (!armv8pmu_counter_has_overflowed(pmovsr, idx))
continue;

hwc = &event->hw;
armpmu_event_update(event);
perf_sample_data_init(&data, 0, hwc->last_period);
if (!armpmu_event_set_period(event))
continue;

if (perf_event_overflow(event, &data, regs))
cpu_pmu->disable(event);
}

}


int perf_event_overflow(struct perf_event *event,
struct perf_sample_data *data,
struct pt_regs *regs)
{
return __perf_event_overflow(event, 1, data, regs);
}