Systrace

systrace

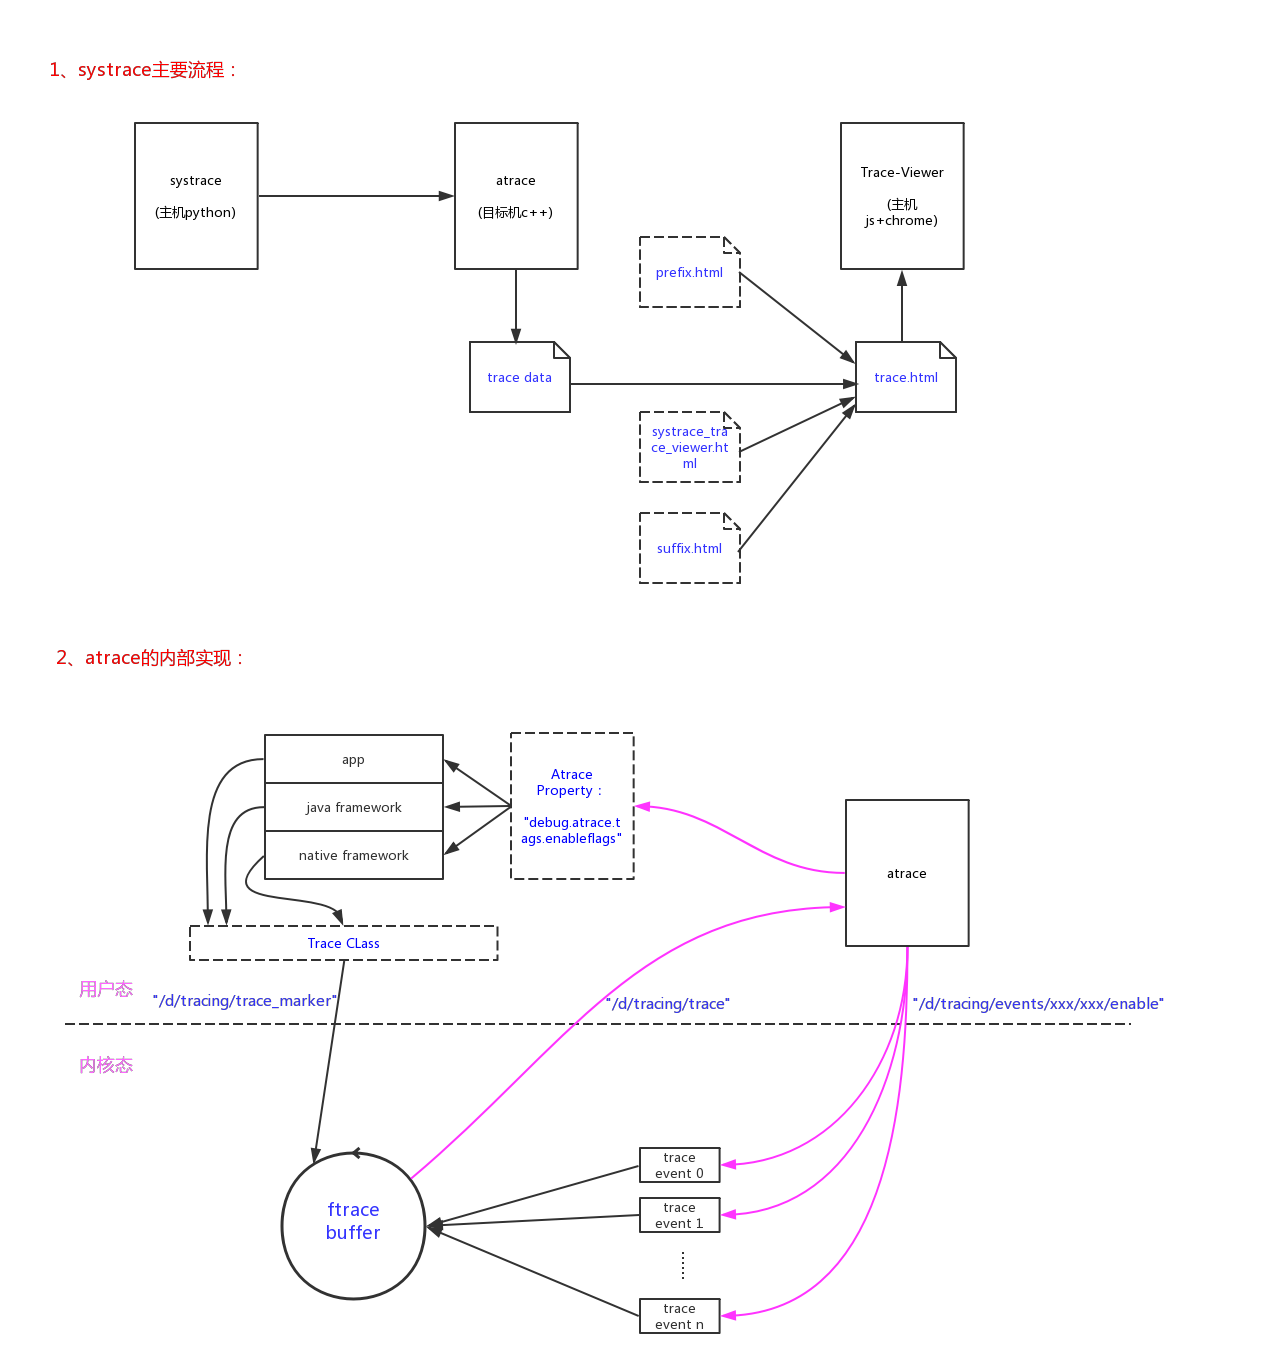
上图基本就能说清systrace的整个框架:

  • 1、systrace调用atrace抓取目标机的trace数据;
  • 2、systrace把trace数据和’prefix.html’、’suffix.html’、’systrace_trace_viewer.html’合成一个’trace.html’文件;
  • 3、使用chrome浏览器打开’trace.html’就可以非常方便的以图形化的形式来查看和分析trace数据。背后是Trace-Viewer的脚本在运行;

内核态和用户态的存储trace数据的实现:

  • 1、内核trace信息,通过trace event记录到ftrace的buffer中;
  • 2、用户态(app/java framework/native)是通过使用Trace类来记录trace信息的,也是记录到内核ftrace buffer当中的,是通过”/sys/kernel/debug/tracing/trace_marker”接口记录的。

1、systrace的使用

在定位Android性能问题的时候,我们经常会用到systrace工具。配置到adb,连接上目标手机,在主机侧使用类似命令启动systrace:

1
2
3
4
5
6
7
ASOP_ROOT/external/chromium-trace/catapult/systrace/bin$ ./systrace -o trace.html -t 10 gfx view wm am dalvik input sched freq idle
Starting tracing (10 seconds)
Tracing completed. Collecting output...
Outputting Systrace results...
Tracing complete, writing results

Wrote trace HTML file: file:///ASOP_ROOT/external/chromium-trace/catapult/systrace/bin/trace.html

systrace命令在ASOP源码包的ASOP_ROOT/external/chromium-trace/catapult/systrace/bin路径下。上述命令的参数:

  • ‘-t 10’,指定了抓取trace的时长为10s;
  • ‘-o trace.html’,指定了trace的输出文件;
  • ‘gfx view wm am dalvik input sched freq idle’,指定了需要抓取的事件;

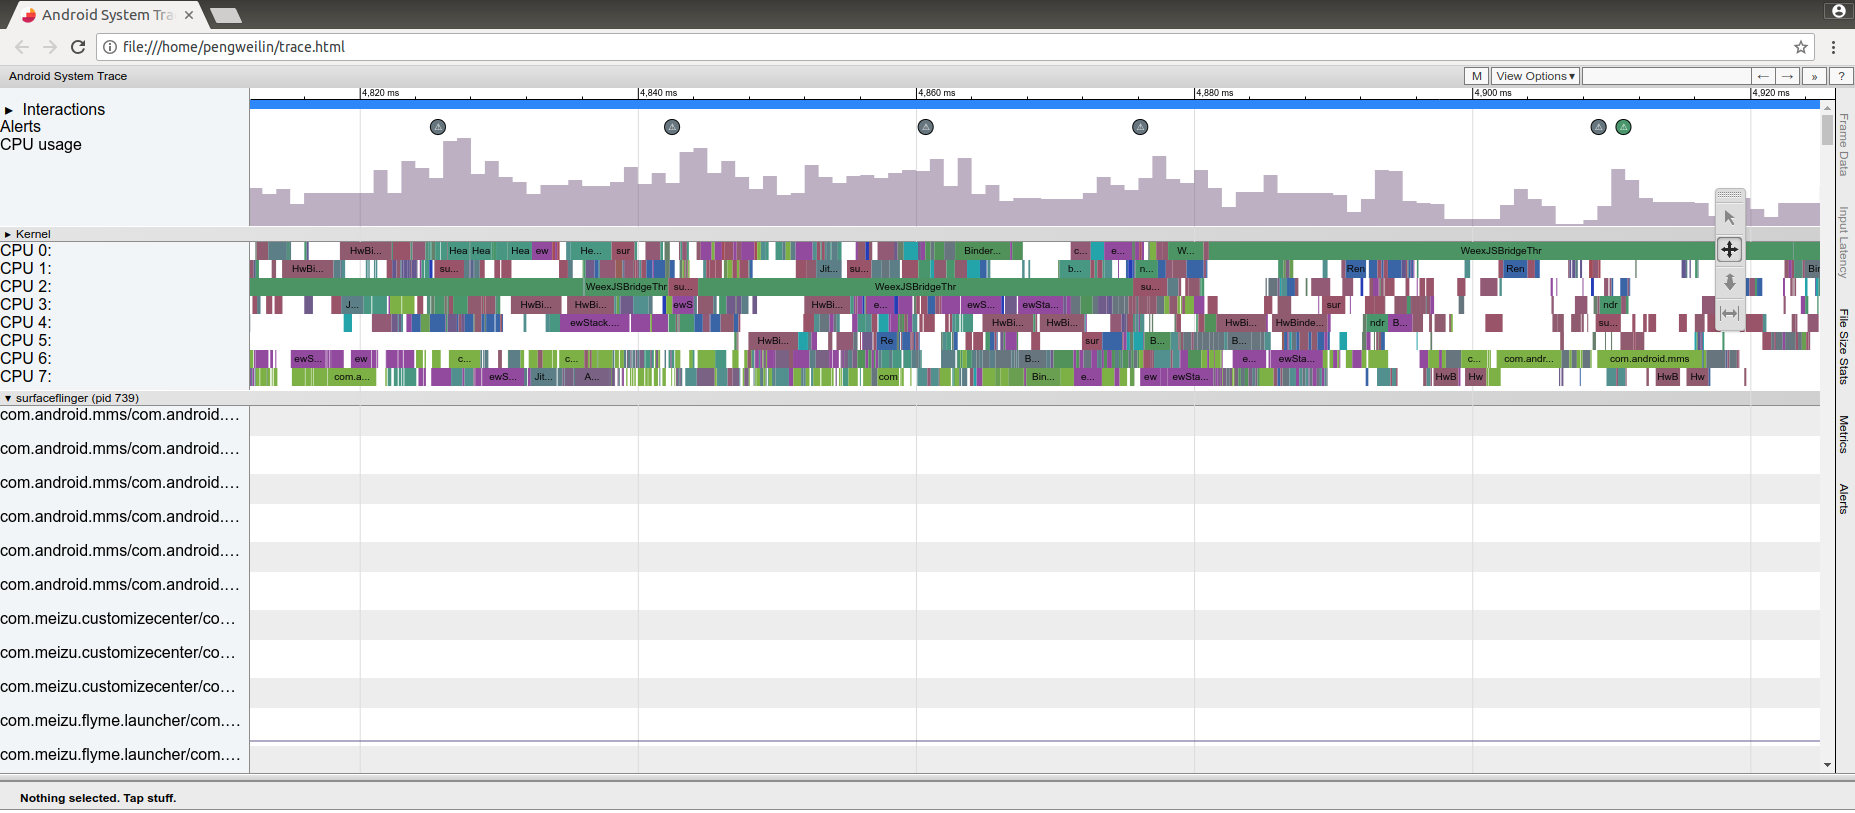
在命令启动以后,我们就可以在目标机上进行滑动、启动app等一系列操作,10s内的这些操作都会被记录下来最后dump进trace.html文件。我们可以通过google的chrome浏览器来查看、分析trace.html:’google-chrome trace.html’。

trace_html

可以通过’-l’选项来查看目标机支持的systrace事件全集:

1
2
3
4
5
6
7
8
9
10
11
12
13
14
15
16
17
18
19
20
21
22
23
24
25
26
27
28
29
30
31
32
33
34
35
36
37
$ ./systrace -l
gfx - Graphics
input - Input
view - View System
webview - WebView
wm - Window Manager
am - Activity Manager
sm - Sync Manager
audio - Audio
video - Video
camera - Camera
hal - Hardware Modules
app - Application
res - Resource Loading
dalvik - Dalvik VM
rs - RenderScript
bionic - Bionic C Library
power - Power Management
pm - Package Manager
ss - System Server
database - Database
network - Network
adb - ADB
pdx - PDX services
sched - CPU Scheduling
irq - IRQ Events
freq - CPU Frequency
idle - CPU Idle
disk - Disk I/O
workq - Kernel Workqueues
memreclaim - Kernel Memory Reclaim
regulators - Voltage and Current Regulators
binder_driver - Binder Kernel driver
binder_lock - Binder global lock trace
pagecache - Page cache

NOTE: more categories may be available with adb root

还可以通过’–help’选项来查看systrace命令的详细选项:

1
2
3
4
5
6
7
8
9
10
11
12
13
14
15
16
17
18
19
20
21
22
23
24
25
26
27
28
29
30
31
32
33
34
35
36
37
38
39
40
41
42
43
44
45
46
47
48
49
50
51
52
53
54
55
56
57
58
59
$ ./systrace --help
Usage: systrace [options] [category1 [category2 ...]]

Example: systrace -b 32768 -t 15 gfx input view sched freq

Options:
-h, --help show this help message and exit
-o FILE write trace output to FILE
-j, --json write a JSON file
--link-assets (deprecated)
--asset-dir=ASSET_DIR
(deprecated)
-e DEVICE_SERIAL_NUMBER, --serial=DEVICE_SERIAL_NUMBER
adb device serial number
--timeout=TIMEOUT timeout for start and stop tracing (seconds)
--collection-timeout=COLLECTION_TIMEOUT
timeout for data collection (seconds)
-t N, --time=N trace for N seconds
--target=TARGET choose tracing target (android or linux)
-b N, --buf-size=N use a trace buffer size of N KB
-l, --list-categories
list the available categories and exit

Atrace options:
--atrace-categories=ATRACE_CATEGORIES
Select atrace categories with a comma-delimited list,
e.g. --atrace-categories=cat1,cat2,cat3
-k KFUNCS, --ktrace=KFUNCS
specify a comma-separated list of kernel functions to
trace
--no-compress Tell the device not to send the trace data in
compressed form.
-a APP_NAME, --app=APP_NAME
enable application-level tracing for comma-separated
list of app cmdlines
--from-file=FROM_FILE
read the trace from a file (compressed) rather than
running a live trace

BattOr trace options:
--battor-categories=BATTOR_CATEGORIES
Select battor categories with a comma-delimited list,
e.g. --battor-categories=cat1,cat2,cat3
--serial-map=SERIAL_MAP
File containing pregenerated map of phone serial
numbers to BattOr serial numbers.
--battor-path=BATTOR_PATH
specify a BattOr path to use
--battor Use the BattOr tracing agent.

Ftrace options:
--ftrace-categories=FTRACE_CATEGORIES
Select ftrace categories with a comma-delimited list,
e.g. --ftrace-categories=cat1,cat2,cat3

WALT trace options:
--walt Use the WALT tracing agent. WALT is a device for
measuring latency of physical sensors on phones and
computers. See https://github.com/google/walt

2、主机systrace命令的实现(python)

systrace实质上是一个python文件,整个python相关包在ASOP_ROOT/external/chromium-trace/catapult/路径下,以此路径为根(root=ASOP_ROOT/external/chromium-trace/catapult),我们来分析它的实现过程:

./systrace/bin/systrace:

1
2
3
4
5
6
7
8
9
10
11
12
13
14
import os
import sys

# (1) 将'./systrace/'路径加入到python的搜索路径 #
_SYSTRACE_DIR = os.path.abspath(
os.path.join(os.path.dirname(__file__), os.path.pardir))
sys.path.insert(0, _SYSTRACE_DIR)

# (2) 这样就能找到'./systrace/systrace/run_systrace.py'模块并导入 #
from systrace import run_systrace

# (3) 调用run_systrace.py模块中的main()函数 #
if __name__ == '__main__':
sys.exit(run_systrace.main())

./systrace/systrace/run_systrace.py:

1
2
3
4
5
6
7
8
9
10
11
12
13
14
15
16
17
18
19
20
21
22
23
24
25
26
27
28
29
30
31
32
33
34
35
36
37
38
39
40
41
42
43
44
45
46
47
48
49
50
51
52
53
54
55
56
57
58
59
60
61
62
63
64
65
66
67
68
69
70
71
72
73
74
75
76
77
78
79
80
81
82
83
84
85
86
87
88
89

# (3.1) main()函数继续调用main_impl()函数 #
def main():
main_impl(sys.argv)


def main_impl(arguments):
# Parse the command line options.

# (3.1.1) 将用户输入的参数解析为options和categories #
options, categories = parse_options(arguments)

# Override --atrace-categories and --ftrace-categories flags if command-line
# categories are provided.

# (3.1.2) 如果解析出了trace事件categories #
# 根据options.target指定的平台'android'/'linux',来给options中的选项赋值 #
# 平台是使用sytrace命令的'--target=TARGET'选项来指定的,如果没有指定默认值是'android' #
if categories:
if options.target == 'android':
options.atrace_categories = categories
elif options.target == 'linux':
options.ftrace_categories = categories
else:
raise RuntimeError('Categories are only valid for atrace/ftrace. Target '
'platform must be either Android or Linux.')


./systrace/systrace/run_systrace.py:
# Include atrace categories by default in Systrace.
# (3.1.3) 如果平台是'android',且没有指定trace事件,给出默认的trace事件 #
if options.target == 'android' and not options.atrace_categories:
options.atrace_categories = atrace_agent.DEFAULT_CATEGORIES

# (3.1.4) 如果平台是'android',且不是从文件中读取数据,那么就是从实际的目标机中读取数据了 #
if options.target == 'android' and not options.from_file:
# 初始化adb #
initialize_devil()
# 如果没有指定目标机的serialnumber,尝试读取 #
if not options.device_serial_number:
devices = [a.GetDeviceSerial() for a in adb_wrapper.AdbWrapper.Devices()]
if len(devices) == 0:
raise RuntimeError('No ADB devices connected.')
elif len(devices) >= 2:
raise RuntimeError('Multiple devices connected, serial number required')
options.device_serial_number = devices[0]

# If list_categories is selected, just print the list of categories.
# In this case, use of the tracing controller is not necessary.
# (3.1.5) 如果当前是'systrace -l'命令,列出目标机支持的所有trace事件后直接返回 #
if options.list_categories:
if options.target == 'android':
# 调用'systrace/systrace/tracing_agents/atrace_agent.py'文件中的list_categories()函数 #
# 最后调用的是`adb shell atrace --list_categories'命令 #
atrace_agent.list_categories(options)
elif options.target == 'linux':
ftrace_agent.list_categories(options)
return

# Set up the systrace runner and start tracing.
# (3.1.6) 如果是普通的trace命令,根据'systrace/systrace/systrace_runner.py'模块中的SystraceRunner类来创建对象 #
controller = systrace_runner.SystraceRunner(
os.path.dirname(os.path.abspath(__file__)), options)

# (3.1.6.1) 开始tracing #
controller.StartTracing()

# Wait for the given number of seconds or until the user presses enter.
# pylint: disable=superfluous-parens
# (need the parens so no syntax error if trying to load with Python 3)
if options.from_file is not None:
print('Reading results from file.')
elif options.trace_time:
print('Starting tracing (%d seconds)' % options.trace_time)
time.sleep(options.trace_time)
else:
raw_input('Starting tracing (stop with enter)')

# Stop tracing and collect the output.
print('Tracing completed. Collecting output...')

# (3.1.6.2) 停止tracing #
controller.StopTracing()

print('Outputting Systrace results...')

# (3.1.6.3) 输出tracing结果到文件中 #
controller.OutputSystraceResults(write_json=options.write_json)

我们可以看到trace过的重点最后落在SystraceRunner对象的创建,以及.StartTracing()/.StopTracing()/.OutputSystraceResults()几个方法上。

下面我们详细分析一下这几个步骤的实现过程。

2.1、SystraceRunner类的初始化

SystraceRunner类在systrace_runner.py文件当中,我们来查看起具体实现。

./systrace/systrace/systrace_runner.py:

1
2
3
4
5
6
7
8
9
10
11
12
13
14
15
16
17
18
19
20
21
22
23
24
25
26
27
28
29
AGENT_MODULES = [android_process_data_agent, atrace_agent,
atrace_from_file_agent, battor_trace_agent,
ftrace_agent, walt_agent]

class SystraceRunner(object):
def __init__(self, script_dir, options):
"""Constructor.

Args:
script_dir: Directory containing the trace viewer script
(systrace_trace_viewer.html)
options: Object containing command line options.
"""
# Parse command line arguments and create agents.
self._script_dir = script_dir
self._out_filename = options.output_file

# (1) #
agents_with_config = tracing_controller.CreateAgentsWithConfig(
options, AGENT_MODULES)

# (2) #
controller_config = tracing_controller.GetControllerConfig(options)

# Set up tracing controller.

# (3) #
self._tracing_controller = tracing_controller.TracingController(
agents_with_config, controller_config)
  • 1、分析tracing_controller.CreateAgentsWithConfig()的实现;

./systrace/systrace/tracing_controller.py:

1
2
3
4
5
6
7
8
9
10
11
12
13
14
15
16
17
18
19
20
21
22
23
24
25
26
27
28
29
30
def CreateAgentsWithConfig(options, modules):
"""Create tracing agents.

This function will determine which tracing agents are valid given the
options and create those agents along with their corresponding configuration
object.
Args:
options: The command-line options.
modules: The modules for either Systrace or profile_chrome.
TODO(washingtonp): After all profile_chrome agents are in
Systrace, this parameter will no longer be valid.
Returns:
A list of AgentWithConfig options containing agents and their corresponding
configuration object.
"""
result = []

# (1.1) 遍历modules中的agent调用相应的函数。对'android'来说,基本只会调用到atrace_agent、android_process_data_agent #
for module in modules:

# (1.1.1) #
config = module.get_config(options)

# (1.1.2) #
agent = module.try_create_agent(config)

if agent and config:
# (1.1.3) 创建一个AgentWithConfig类的对象,用来存储config和agent #
result.append(AgentWithConfig(agent, config))
return [x for x in result if x and x.agent]

|→

./systrace/systrace/tracing_agents/atrace_agent.py:

1
2
3
4
5
6
7
8
9
10
11
12
13
14
15
16
17
18
19
20
21
22
23
24
# (1.1.1) 创建一个AtraceConfig类的对象,用来存储optios中的相关配置 #
def get_config(options):
return AtraceConfig(options.atrace_categories,
options.trace_buf_size, options.kfuncs,
options.app_name, options.compress_trace_data,
options.from_file, options.device_serial_number,
options.trace_time, options.target)


class AtraceConfig(tracing_agents.TracingConfig):
def __init__(self, atrace_categories, trace_buf_size, kfuncs,
app_name, compress_trace_data, from_file,
device_serial_number, trace_time, target):
tracing_agents.TracingConfig.__init__(self)
self.atrace_categories = atrace_categories
self.trace_buf_size = trace_buf_size
self.kfuncs = kfuncs
self.app_name = app_name
self.compress_trace_data = compress_trace_data
self.from_file = from_file
self.device_serial_number = device_serial_number
self.trace_time = trace_time
self.target = target
1
2
3
4
5
6
7
8
9
10
11
12
13
14
15
16
17
18
19
20
21
22
23
24
25
26
27
28
29
30
31
32
33
34
35
36
37
38
39
40
41
# (1.1.2) 创建一个AtraceAgent类的对象 #
def try_create_agent(config):
"""Create an Atrace agent.

Args:
config: Command line config.
"""

# 根据config的配置,判断当前Atrace agent是否需要创建 #
if config.target != 'android':
return None
if config.from_file is not None:
return None

if not config.atrace_categories:
return None

# Check device SDK version.
device_sdk_version = util.get_device_sdk_version()
if device_sdk_version < version_codes.JELLY_BEAN_MR2:
print ('Device SDK versions < 18 (Jellybean MR2) not supported.\n'
'Your device SDK version is %d.' % device_sdk_version)
return None

return AtraceAgent(device_sdk_version)


class AtraceAgent(tracing_agents.TracingAgent):

def __init__(self, device_sdk_version):
super(AtraceAgent, self).__init__()
self._device_sdk_version = device_sdk_version
self._adb = None
self._trace_data = None
self._tracer_args = None
self._collection_thread = None
self._device_utils = None
self._device_serial_number = None
self._config = None
self._categories = None

|→

./systrace/systrace/tracing_agents/android_process_data_agent.py:

1
2
3
4
5
6
7
8
9
10
11
12
13
14
def try_create_agent(config):
if config.target != 'android':
return None
if config.from_file is not None:
return None
return AndroidProcessDataAgent()


class AndroidProcessDataAgent(tracing_agents.TracingAgent):
def __init__(self):
super(AndroidProcessDataAgent, self).__init__()
self._trace_data = ""
self._device = None
  • 2、分析tracing_controller.GetControllerConfig()的实现;

./systrace/systrace/tracing_controller.py:

1
2
3
4
5
6
7
8
9
10
11
12
13
14
15
16
17
18
19
20
21
22
23
24
# (2.1) 创建一个TracingControllerConfig类的对象,用来存储optios中的相关配置 #
def GetControllerConfig(options):
return TracingControllerConfig(options.output_file, options.trace_time,
options.write_json,
options.link_assets, options.asset_dir,
options.timeout, options.collection_timeout,
options.device_serial_number, options.target)


class TracingControllerConfig(tracing_agents.TracingConfig):
def __init__(self, output_file, trace_time, write_json,
link_assets, asset_dir, timeout, collection_timeout,
device_serial_number, target):
tracing_agents.TracingConfig.__init__(self)
self.output_file = output_file
self.trace_time = trace_time
self.write_json = write_json
self.link_assets = link_assets
self.asset_dir = asset_dir
self.timeout = timeout
self.collection_timeout = collection_timeout
self.device_serial_number = device_serial_number
self.target = target
  • 3、分析tracing_controller.TracingController()的实现;

./systrace/systrace/tracing_controller.py:

1
2
3
4
5
6
7
8
9
10
11
12
13
14
15
16
17
18
19
20
21
22
23
# (3.1) 创建一个TracingController类的对象,稍后的start/stop/output操作都使用该对象的方法 #
class TracingController(object):
def __init__(self, agents_with_config, controller_config):
"""Create tracing controller.

Create a tracing controller object. Note that the tracing
controller is also a tracing agent.

Args:
agents_with_config: List of tracing agents for this controller with the
corresponding tracing configuration objects.
controller_config: Configuration options for the tracing controller.
"""
self._child_agents = None

# (3.1.1) 存储agent对象和config #
self._child_agents_with_config = agents_with_config
# (3.1.2) 新建一个TracingControllerAgent类的对象 #
self._controller_agent = TracingControllerAgent()
# (3.1.3) 存储controller层级的config #
self._controller_config = controller_config
self._trace_in_progress = False
self.all_results = None

2.2、SystraceRunner.StartTracing()

入口是SystraceRunner类的.StartTracing()方法,./systrace/systrace/systrace_runner.py:

1
2
3
4
5
class SystraceRunner(object):

def StartTracing(self):
# (1) #
self._tracing_controller.StartTracing()

继续调用到TracingController类的.StartTracing()方法,./systrace/systrace/tracing_controller.py:

1
2
3
4
5
6
7
8
9
10
11
12
13
14
15
16
17
18
19
20
21
22
23
24
25
26
27
28
29
30
31
32
33
34
35
36
37
38
39
40
41
42
43
44
45
46
47
48
49
50
51
class TracingController(object):

def StartTracing(self):
"""Start tracing for all tracing agents.

This function starts tracing for both the controller tracing agent
and the child tracing agents.

Returns:
Boolean indicating whether or not the start tracing succeeded.
Start tracing is considered successful if at least the
controller tracing agent was started.
"""

# (1.1) 设置对象中的tracing启动标志 #
assert not self._trace_in_progress, 'Trace already in progress.'
self._trace_in_progress = True

# Start the controller tracing agents. Controller tracing agent
# must be started successfully to proceed.
# (1.2) 启动成员对象_controller_agent的.StartAgentTracing()方法 #
# 记录一些log #
if not self._controller_agent.StartAgentTracing(
self._controller_config,
timeout=self._controller_config.timeout):
print 'Unable to start controller tracing agent.'
return False

# Start the child tracing agents.
succ_agents = []
# (1.3) 逐个启动agent list中agent的.StartAgentTracing()方法 #
# 对'Android'来说,就一个agent:AtraceAgent #
for agent_and_config in self._child_agents_with_config:
agent = agent_and_config.agent
config = agent_and_config.config

# 启动agent #
if agent.StartAgentTracing(config,
timeout=self._controller_config.timeout):
# 把启动成功的agent加入succ_agents list #
succ_agents.append(agent)
else:
print 'Agent %s not started.' % str(agent)

# Print warning if all agents not started.
na = len(self._child_agents_with_config)
ns = len(succ_agents)
if ns < na:
print 'Warning: Only %d of %d tracing agents started.' % (ns, na)
self._child_agents = succ_agents
return True

|→

继续调用到AtraceAgent类的.StartTracing()方法,./systrace/systrace/tracing_agents/atrace_agent.py:

1
2
3
4
5
6
7
8
9
10
11
12
13
14
15
16
17
18
19
20
21
22
23
24
25
26
27
28
29
30
31
32
33
34
35
36
37
38
class AtraceAgent(tracing_agents.TracingAgent):

@py_utils.Timeout(tracing_agents.START_STOP_TIMEOUT)
def StartAgentTracing(self, config, timeout=None):
assert config.atrace_categories, 'Atrace categories are missing!'
self._config = config

# systrace命令下达的需要trace的事件 #
self._categories = config.atrace_categories
if isinstance(self._categories, list):
self._categories = ','.join(self._categories)

# 使用'atrace --list_categories'获取的目标机支持的可trace事件 #
avail_cats = get_available_categories(config, self._device_sdk_version)

# (1.3.1) 判断命令中是否有目标机不支持的trace事件 #
unavailable = [x for x in self._categories.split(',') if
x not in avail_cats]
self._categories = [x for x in self._categories.split(',') if
x in avail_cats]
if unavailable:
print 'These categories are unavailable: ' + ' '.join(unavailable)
self._device_utils = device_utils.DeviceUtils(config.device_serial_number)
self._device_serial_number = config.device_serial_number

# (1.3.2) 构造参数:'atrace ... categories' #
# '...'包括以下选项: #
# '-z': compress_trace_data #
# '-t trace_time' #
# '-b trace_buf_size' #
# '-a app_name' #
# '-k kfuncs' #
self._tracer_args = _construct_atrace_args(config,
self._categories)
# (1.3.3) 执行命令:'atrace ... categories --async_start' #
self._device_utils.RunShellCommand(
self._tracer_args + ['--async_start'], check_return=True)
return True

|→

继续调用到AndroidProcessDataAgent类的.StartTracing()方法,./systrace/systrace/tracing_agents/android_process_data_agent.py:

1
2
3
4
5
6
7
8
9
10
11
12
13
14
15
16
17
18
19
20
21
22
23
24
25
26
27
28
29
30
31
32
33
class AndroidProcessDataAgent(tracing_agents.TracingAgent):

@py_utils.Timeout(tracing_agents.START_STOP_TIMEOUT)
def StartAgentTracing(self, config, timeout=None):
self._device = device_utils.DeviceUtils(config.device_serial_number)
self._trace_data += self._get_process_snapshot()
return True


def _get_process_snapshot(self):
use_legacy = False
try:
dump = self._device.RunShellCommand( \
PS_COMMAND_PROC, check_return=True, as_root=True, shell=True)
except AdbShellCommandFailedError:
use_legacy = True

# Check length of 2 as we execute two commands, which in case of failure
# on old devices output 1 line each.
if use_legacy or len(dump) == 2:
logging.debug('Couldn\'t parse ps dump, trying legacy method ...')
dump = self._device.RunShellCommand( \
PS_COMMAND_PROC_LEGACY, check_return=True, as_root=True, shell=True)
if len(dump) == 2:
logging.error('Unable to extract process data!')
return ""

return '\n'.join(dump) + '\n'

# 实际上就是在StartTracing()和StopTracing()时,各调用一次如下的ps命令 #
PS_COMMAND_PROC = "ps -A -o USER,PID,PPID,VSIZE,RSS,WCHAN,ADDR=PC,S,NAME,COMM" \
"&& ps -AT -o USER,PID,TID,CMD"

2.3、SystraceRunner.StopTracing()

入口是SystraceRunner类的.StopTracing()方法,./systrace/systrace/systrace_runner.py:

1
2
3
4
5
class SystraceRunner(object):

def StopTracing(self):
# (1) #
self._tracing_controller.StopTracing()

继续调用到TracingController类的.StopTracing()方法,./systrace/systrace/tracing_controller.py:

1
2
3
4
5
6
7
8
9
10
11
12
13
14
15
16
17
18
19
20
21
22
23
24
25
26
27
28
29
30
31
32
33
34
35
36
37
38
39
40
41
42
43
44
45
46
47
48
49
50
51
52
53
54
55
56
57
58
59
60
61
62
63
64
65
66
67
68
69
class TracingController(object):

def StopTracing(self):
"""Issue clock sync marker and stop tracing for all tracing agents.

This function stops both the controller tracing agent
and the child tracing agents. It issues a clock sync marker prior
to stopping tracing.

Returns:
Boolean indicating whether or not the stop tracing succeeded
for all agents.
"""

# (1.1) 清除对象中的tracing启动标志 #
assert self._trace_in_progress, 'No trace in progress.'
self._trace_in_progress = False

# Issue the clock sync marker and stop the child tracing agents.
self._IssueClockSyncMarker()
succ_agents = []
# (1.2) 逐个调用agent list中agent的.StopAgentTracing()方法 #
# 对'Android'来说,就一个agent:AtraceAgent #
for agent in self._child_agents:
if agent.StopAgentTracing(timeout=self._controller_config.timeout):
succ_agents.append(agent)
else:
print 'Agent %s not stopped.' % str(agent)

# Stop the controller tracing agent. Controller tracing agent
# must be stopped successfully to proceed.
# (1.3) 调用成员对象_controller_agent的.StartAgentTracing()方法 #
# 记录一些log #
if not self._controller_agent.StopAgentTracing(
timeout=self._controller_config.timeout):
print 'Unable to stop controller tracing agent.'
return False

# Print warning if all agents not stopped.
na = len(self._child_agents)
ns = len(succ_agents)
if ns < na:
print 'Warning: Only %d of %d tracing agents stopped.' % (ns, na)
self._child_agents = succ_agents

# Collect the results from all the stopped tracing agents.
all_results = []
# (1.4) 汇总agent list中agent和成员对象_controller_agent所有的result #
for agent in self._child_agents + [self._controller_agent]:
try:
result = agent.GetResults(
timeout=self._controller_config.collection_timeout)
if not result:
print 'Warning: Timeout when getting results from %s.' % str(agent)
continue
if result.source_name in [r.source_name for r in all_results]:
print ('Warning: Duplicate tracing agents named %s.' %
result.source_name)
all_results.append(result)
# Check for exceptions. If any exceptions are seen, reraise and abort.
# Note that a timeout exception will be swalloed by the timeout
# mechanism and will not get to that point (it will return False instead
# of the trace result, which will be dealt with above)
except:
print 'Warning: Exception getting results from %s:' % str(agent)
print sys.exc_info()[0]
raise
self.all_results = all_results
return all_results

|→

继续调用到AtraceAgent类的.StopAgentTracing()方法,./systrace/systrace/tracing_agents/atrace_agent.py:

1
2
3
4
5
6
7
8
9
10
11
12
13
14
15
16
17
18
19
20
21
22
23
24
25
26
27
28
29
30
31
32
33
34
35
36
37
38
39
40
41
42
43
44
45
46
47
48
49
50
51
52
53
54
55
56
57
58
59
60
61
62
63
64
65
66
67
68
69
70
71
72
73
74
75
76
77
78
79
80
81
82
83
84
85
86
87
88
class AtraceAgent(tracing_agents.TracingAgent):

@py_utils.Timeout(tracing_agents.START_STOP_TIMEOUT)
def StopAgentTracing(self, timeout=None):
"""Stops tracing and starts collecting results.

To synchronously retrieve the results after calling this function,
call GetResults().
"""

# (1.2.1) 启动stop tracing的线程 #
self._collection_thread = threading.Thread(
target=self._collect_and_preprocess)
self._collection_thread.start()
return True


def _collect_and_preprocess(self):
"""Collects and preprocesses trace data.

Stores results in self._trace_data.
"""

# (1.2.1.1) dump trace数据,并stop tracing #
trace_data = self._collect_trace_data()

# (1.2.1.2) 对获取的trace数据进行预处理 #
self._trace_data = self._preprocess_trace_data(trace_data)


def _collect_trace_data(self):
"""Reads the output from atrace and stops the trace."""

# (1.2.1.1.1) dump出trace数据 #
# 执行命令:'atrace ... categories --async_dump' #
dump_cmd = self._tracer_args + ['--async_dump']
result = self._device_utils.RunShellCommand(
dump_cmd, raw_output=True, large_output=True, check_return=True)

# (1.2.1.1.2) 找到trace数据中'TRACE\:'开头的位置 #
data_start = re.search(TRACE_START_REGEXP, result)
if data_start:
data_start = data_start.end(0)
else:
raise IOError('Unable to get atrace data. Did you forget adb root?')

# (1.2.1.1.3) 清除trace数据中类似无效数据:r'^capturing trace\.\.\. done|^capturing trace\.\.\.' #
output = re.sub(ADB_IGNORE_REGEXP, '', result[data_start:])

# (1.2.1.1.4) stop tracing #
# 执行命令:'atrace ... categories --async_stop' #
self._stop_trace()
return output

def _preprocess_trace_data(self, trace_data):
"""Performs various processing on atrace data.

Args:
trace_data: The raw trace data.
Returns:
The processed trace data.
"""

# (1.2.1.2.1) 对trace数据进行一些strp和解压 #
if trace_data:
trace_data = strip_and_decompress_trace(trace_data)

if not trace_data:
print >> sys.stderr, ('No data was captured. Output file was not '
'written.')
sys.exit(1)

# (1.2.1.2.2) 修复MISSING_TGIDS #
if _FIX_MISSING_TGIDS:
# Gather proc data from device and patch tgids
procfs_dump = self._device_utils.RunShellCommand(
'echo -n /proc/[0-9]*/task/[0-9]*',
shell=True, check_return=True)[0].split(' ')
pid2_tgid = extract_tgids(procfs_dump)
trace_data = fix_missing_tgids(trace_data, pid2_tgid)

# (1.2.1.2.3) 修复CIRCULAR_TRACES #
if _FIX_CIRCULAR_TRACES:
trace_data = fix_circular_traces(trace_data)

return trace_data

|→

继续调用到AndroidProcessDataAgent类的.StopAgentTracing()方法,./systrace/systrace/tracing_agents/android_process_data_agent.py:

1
2
3
4
5
6
7
8
9
10
11
12
13
14
15
16
17
18
19
20
21
22
23
24
25
26
27
28
29
30
31
32
class AndroidProcessDataAgent(tracing_agents.TracingAgent):

@py_utils.Timeout(tracing_agents.START_STOP_TIMEOUT)
def StopAgentTracing(self, timeout=None):
self._trace_data += self._get_process_snapshot()
return True


def _get_process_snapshot(self):
use_legacy = False
try:
dump = self._device.RunShellCommand( \
PS_COMMAND_PROC, check_return=True, as_root=True, shell=True)
except AdbShellCommandFailedError:
use_legacy = True

# Check length of 2 as we execute two commands, which in case of failure
# on old devices output 1 line each.
if use_legacy or len(dump) == 2:
logging.debug('Couldn\'t parse ps dump, trying legacy method ...')
dump = self._device.RunShellCommand( \
PS_COMMAND_PROC_LEGACY, check_return=True, as_root=True, shell=True)
if len(dump) == 2:
logging.error('Unable to extract process data!')
return ""

return '\n'.join(dump) + '\n'

# 实际上就是在StartTracing()和StopTracing()时,各调用一次如下的ps命令 #
PS_COMMAND_PROC = "ps -A -o USER,PID,PPID,VSIZE,RSS,WCHAN,ADDR=PC,S,NAME,COMM" \
"&& ps -AT -o USER,PID,TID,CMD"

2.4、SystraceRunner.OutputSystraceResults()

入口是SystraceRunner类的.OutputSystraceResults()方法,./systrace/systrace/systrace_runner.py:

1
2
3
4
5
6
7
8
9
10
11
12
13
14
15
16
17
18
19
20
21
22
23
24
25
26
27
class SystraceRunner(object):

def OutputSystraceResults(self, write_json=False):
"""Output the results of systrace to a file.

If output is necessary, then write the results of systrace to either (a)
a standalone HTML file, or (b) a json file which can be read by the
trace viewer.

Args:
write_json: Whether to output to a json file (if false, use HTML file)
"""
print 'Tracing complete, writing results'
if write_json:
# (1) 输出成jason格式 #
result = output_generator.GenerateJSONOutput(
self._tracing_controller.all_results,
self._out_filename)
else:
# (2) 输出成html格式 #
# all_results是上一步stoptracing时得到的trace结果 #
# _out_filename是使用'-o'选项指定的文件名 #
result = output_generator.GenerateHTMLOutput(
self._tracing_controller.all_results,
self._out_filename)
print '\nWrote trace %s file: file://%s\n' % (('JSON' if write_json
else 'HTML'), result)

继续调用到output_generator模块中的GenerateHTMLOutput()函数,./systrace/systrace/output_generator.py:

1
2
3
4
5
6
7
8
9
10
11
12
13
14
15
16
17
18
19
20
21
22
23
24
25
26
27
28
29
30
31
32
33
34
35
36
37
38
39
40
41
42
43
44
45
46
47
48
49
50
51
52
53
54
55
56
57
58
59
60
61
62
63
64
65
66
67
68
69
70
71
72
73
74
75
def GenerateHTMLOutput(trace_results, output_file_name):
"""Write the results of systrace to an HTML file.

Args:
trace_results: A list of TraceResults.
output_file_name: The name of the HTML file that the trace viewer
results should be written to.
"""
def _ReadAsset(src_dir, filename):
return open(os.path.join(src_dir, filename)).read()

# TODO(rnephew): The tracing output formatter is able to handle a single
# systrace trace just as well as it handles multiple traces. The obvious thing
# to do here would be to use it all for all systrace output: however, we want
# to continue using the legacy way of formatting systrace output when a single
# systrace and the tracing controller trace are present in order to match the
# Java verison of systrace. Java systrace is expected to be deleted at a later
# date. We should consolidate this logic when that happens.

# (2.1) 如果result list中成员个数大于3,使用新方法NewGenerateHTMLOutput #
if len(trace_results) > 3:
NewGenerateHTMLOutput(trace_results, output_file_name)
return os.path.abspath(output_file_name)

systrace_dir = os.path.abspath(os.path.dirname(__file__))

# (2.2) 尝试更新./systrace/systrace/systrace_trace_viewer.html文件 #
try:
from systrace import update_systrace_trace_viewer
except ImportError:
pass
else:
update_systrace_trace_viewer.update()

trace_viewer_html = _ReadAsset(systrace_dir, 'systrace_trace_viewer.html')

# Open the file in binary mode to prevent python from changing the
# line endings, then write the prefix.

# (2.3) 读出'prefix.html','suffix.html','systrace_trace_viewer.html'文件的内容备用 #
systrace_dir = os.path.abspath(os.path.dirname(__file__))
html_prefix = _ReadAsset(systrace_dir, 'prefix.html')
html_suffix = _ReadAsset(systrace_dir, 'suffix.html')
trace_viewer_html = _ReadAsset(systrace_dir,
'systrace_trace_viewer.html')

# Open the file in binary mode to prevent python from changing the
# line endings, then write the prefix.
# (2.4) 打开一个名为'xxx.html'的输出文件,准备写入 #
html_file = open(output_file_name, 'wb')

# (2.4.1) 首先写入'prefix.html'的内容 #
# 并且把其中的'{{SYSTRACE_TRACE_VIEWER_HTML}}'字符用'systrace_trace_viewer.html'的文件内容替换 #
html_file.write(html_prefix.replace('{{SYSTRACE_TRACE_VIEWER_HTML}}',
trace_viewer_html))

# Write the trace data itself. There is a separate section of the form
# <script class="trace-data" type="application/text"> ... </script>
# for each tracing agent (including the controller tracing agent).

# (2.4.2) 逐个按格式写入trace_results中的trace数据 #
html_file.write('<!-- BEGIN TRACE -->\n')
for result in trace_results:
html_file.write(' <script class="trace-data" type="application/text">\n')
html_file.write(_ConvertToHtmlString(result.raw_data))
html_file.write(' </script>\n')
html_file.write('<!-- END TRACE -->\n')

# Write the suffix and finish.
# (2.4.3) 最后写入'suffix.html'的内容 #
html_file.write(html_suffix)
html_file.close()

final_path = os.path.abspath(output_file_name)
return final_path

2.4、执行的命令

我们在devil/devil/android/device_utils.py的RunShellCommand.run()和devil/devil/utils/cmd_helper.py的Popen()处加上调试打印,看到’./systrace -o trace.html -t 10 gfx view wm am dalvik input sched freq idle‘命令的具体执行过程如下:

1
2
3
4
5
6
7
8
9
10
11
12
13
14
15
16
17
18
19
20
21
22
23
24
25
26
27
28
29
30
ASOP_ROOT/external/chromium-trace/catapult/systrace/bin/systrace -o trace.html -t 10 gfx view wm am dalvik input sched freq idle
Popen: [u'/usr/bin/adb', 'devices']
run: ( c=/data/local/tmp/cache_token;echo $EXTERNAL_STORAGE;cat $c 2>/dev/null||echo;echo "636d6fb8-d59c-11e8-ae24-b8ca3a959992">$c &&getprop )>/data/local/tmp/temp_file-4aec8d95e60eb
Popen: [u'/usr/bin/adb', '-s', '872QADT5KWKRG', 'shell', '( ( c=/data/local/tmp/cache_token;echo $EXTERNAL_STORAGE;cat $c 2>/dev/null||echo;echo "636d6fb8-d59c-11e8-ae24-b8ca3a959992">$c &&getprop )>/data/local/tmp/temp_file-4aec8d95e60eb );echo %$?']
Popen: [u'/usr/bin/adb', '-s', '872QADT5KWKRG', 'pull', '/data/local/tmp/temp_file-4aec8d95e60eb', '/tmp/tmple_FOq/tmp_ReadFileWithPull']
run: su 0 ls /root && ! ls /root
Popen: [u'/usr/bin/adb', '-s', '872QADT5KWKRG', Popen: [u'/usr/bin/adb', 'shell''-s', , '8'( su 0 ls72QADT5KWKRG', /root && ! ls /root 'shell', );echo'rm -f /data/local/tmp/ %$?']temp_file-4aec8d95e60eb']

run: ps -A -o USER,PID,PPID,VSIZE,RSS,WCHAN,ADDR=PC,S,NAME,COMM&& ps -AT -o USER,PID,TID,CMD
Popen: [u'/usr/bin/adb', '-s', '872QADT5KWKRG', 'shell', '( ps -A -o USER,PID,PPID,VSIZE,RSS,WCHAN,ADDR=PC,S,NAME,COMM&& ps -AT -o USER,PID,TID,CMD );echo %$?']
run: atrace --list_categories
Popen: [u'/usr/bin/adb', '-s', '872QADT5KWKRG', 'shell', '( atrace --list_categories );echo %$?']
run: atrace -z -t 10 -b 4096 gfx view wm am dalvik input sched freq idle --async_start
Popen: [u'/usr/bin/adb', '-s', '872QADT5KWKRG', 'shell', '( atrace -z -t 10 -b 4096 gfx view wm am dalvik input sched freq idle --async_start );echo %$?']
Starting tracing (10 seconds)
Tracing completed. Collecting output...
run: ps -A -o USER,PID,PPID,VSIZE,RSS,WCHAN,ADDR=PC,S,NAME,COMM&& ps -AT -o USER,PID,TID,CMD
Popen: [u'/usr/bin/adb', '-s', '872QADT5KWKRG', 'shell', '( ps -A -o USER,PID,PPID,VSIZE,RSS,WCHAN,ADDR=PC,S,NAME,COMM&& ps -AT -o USER,PID,TID,CMD );echo %$?']
run: ( atrace -z -t 10 -b 4096 gfx view wm am dalvik input sched freq idle --async_dump )>/data/local/tmp/temp_file-57edea8625b51
Popen: [u'/usr/bin/adb', '-s', '872QADT5KWKRG', 'shell', '( ( atrace -z -t 10 -b 4096 gfx view wm am dalvik input sched freq idle --async_dump )>/data/local/tmp/temp_file-57edea8625b51 );echo %$?']
Popen: [u'/usr/bin/adb', '-s', '872QADT5KWKRG', 'pull', '/data/local/tmp/temp_file-57edea8625b51', '/tmp/tmp_preLk/tmp_ReadFileWithPull']
Popen: [u'/usr/bin/adb', '-s', '872QADT5KWKRG', 'shell', 'rm -f /data/local/tmp/temp_file-57edea8625b51']
run: atrace -z -t 10 -b 4096 gfx view wm am dalvik input sched freq idle --async_stop
Popen: [u'/usr/bin/adb', '-s', '872QADT5KWKRG', 'shell', '( atrace -z -t 10 -b 4096 gfx view wm am dalvik input sched freq idle --async_stop );echo %$?']
run: echo -n /proc/[0-9]*/task/[0-9]*
Popen: [u'/usr/bin/adb', '-s', '872QADT5KWKRG', 'shell', '( echo -n /proc/[0-9]*/task/[0-9]* );echo %$?']
Outputting Systrace results...
Tracing complete, writing results

Wrote trace HTML file: file:///home/pengweilin/sdb2/m1872/code/repo/external/chromium-trace/catapult/systrace/bin/pwl1.html

精简起来是调用目标机上的atrace命令实现的:

1
2
3
4
5
adb shell atrace -z -t 10 -b 4096 gfx view wm am dalvik input sched freq idle --async_start
adb shell atrace -z -t 10 -b 4096 gfx view wm am dalvik input sched freq idle --async_dump > /data/local/tmp/temp_file-57edea8625b51
adb pull /data/local/tmp/temp_file-57edea8625b51 /tmp/tmp_preLk/tmp_ReadFileWithPull
adb shell rm -f /data/local/tmp/temp_file-57edea8625b51
adb shell atrace -z -t 10 -b 4096 gfx view wm am dalvik input sched freq idle --async_stop

3、目标机atrace命令的实现(c++)

从上一节可以看到主机的systrace命令实际最后都是调用目标机上的atrace命令实现的。从atrace的命令格式上看,分为两部分:

  • [options]:就是’-‘和’–’打头的选项;
  • [categories…]:指定需要trace哪些事件。就是类似’gfx view wm am dalvik input sched freq idle’这些;
1
2
3
4
5
6
7
8
9
10
11
12
13
14
15
16
17
18
19
20
21
22
23
24
25
$ atrace --help
usage: atrace [options] [categories...]
options include:
-a appname enable app-level tracing for a comma separated list of cmdlines
-b N use a trace buffer size of N KB
-c trace into a circular buffer
-f filename use the categories written in a file as space-separated
values in a line
-k fname,... trace the listed kernel functions
-n ignore signals
-s N sleep for N seconds before tracing [default 0]
-t N trace for N seconds [default 5]
-z compress the trace dump
--async_start start circular trace and return immediately
--async_dump dump the current contents of circular trace buffer
--async_stop stop tracing and dump the current contents of circular
trace buffer
--stream stream trace to stdout as it enters the trace buffer
Note: this can take significant CPU time, and is best
used for measuring things that are not affected by
CPU performance, like pagecache usage.
--list_categories
list the available tracing categories
-o filename write the trace to the specified file instead
of stdout.

atrace的源码在ASOP_ROOT/frameworks/native/cmds/atrace/atrace.cpp,我们来具体分析一下它的实现:

1
2
3
4
5
6
7
8
9
10
11
12
13
14
15
16
17
18
19
20
21
22
23
24
25
26
27
28
29
30
31
32
33
34
35
36
37
38
39
40
41
42
43
44
45
46
47
48
49
50
51
52
53
54
55
56
57
58
59
60
61
62
63
64
65
66
67
68
69
70
71
72
73
74
75
76
77
78
79
80
81
82
83
84
85
86
87
88
89
90
91
92
93
94
95
96
97
98
99
100
101
102
103
104
105
106
107
108
109
110
111
112
113
114
115
116
117
118
119
120
121
122
123
124
125
126
127
128
129
130
131
132
133
134
135
136
137
138
139
140
141
142
143
144
145
146
147
148
149
150
151
152
153
154
155
156
157
158
159
160
161
162
163
164
165
166
167
168
169
170
171
172
173
174
175
176
177
178
179
180
181
182
183
184
185
186
187
188
189
190
191
192
193
194
195
196
197
198
199
200
201
202
203
204
205
206
207
208
209
210
int main(int argc, char **argv)
{
bool async = false;
bool traceStart = true;
bool traceStop = true;
bool traceDump = true;
bool traceStream = false;

/* (1) atrace跟"--help"选项,印出帮助信息 */
if (argc == 2 && 0 == strcmp(argv[1], "--help")) {
showHelp(argv[0]);
exit(0);
}

/* (2) ftrace目录是否存在 */
if (!findTraceFiles()) {
fprintf(stderr, "No trace folder found\n");
exit(-1);
}

/* (3) 逐条解析atrace的命令参数 */
for (;;) {
int ret;
int option_index = 0;
static struct option long_options[] = {
{"async_start", no_argument, 0, 0 },
{"async_stop", no_argument, 0, 0 },
{"async_dump", no_argument, 0, 0 },
{"list_categories", no_argument, 0, 0 },
{"stream", no_argument, 0, 0 },
{ 0, 0, 0, 0 }
};

/* (3.1) 尝试使用option来解析atrace的命令参数 */
ret = getopt_long(argc, argv, "a:b:cf:k:ns:t:zo:",
long_options, &option_index);

/* (3.2) 如果使用option解析失败,尝试使用category来进行解析 */
if (ret < 0) {
for (int i = optind; i < argc; i++) {
if (!setCategoryEnable(argv[i], true)) {
fprintf(stderr, "error enabling tracing category \"%s\"\n", argv[i]);
exit(1);
}
}
break;
}

/* (3.3) 根据解析出来的option,设置flag */
switch(ret) {
case 'a':
g_debugAppCmdLine = optarg;
break;

case 'b':
g_traceBufferSizeKB = atoi(optarg);
break;

case 'c':
g_traceOverwrite = true;
break;

case 'f':
g_categoriesFile = optarg;
break;

case 'k':
g_kernelTraceFuncs = optarg;
break;

case 'n':
g_nohup = true;
break;

case 's':
g_initialSleepSecs = atoi(optarg);
break;

case 't':
g_traceDurationSeconds = atoi(optarg);
break;

case 'z':
g_compress = true;
break;

case 'o':
g_outputFile = optarg;
break;

case 0:
if (!strcmp(long_options[option_index].name, "async_start")) {
async = true;
traceStop = false;
traceDump = false;
g_traceOverwrite = true;
} else if (!strcmp(long_options[option_index].name, "async_stop")) {
async = true;
traceStart = false;
} else if (!strcmp(long_options[option_index].name, "async_dump")) {
async = true;
traceStart = false;
traceStop = false;
} else if (!strcmp(long_options[option_index].name, "stream")) {
traceStream = true;
traceDump = false;
} else if (!strcmp(long_options[option_index].name, "list_categories")) {
listSupportedCategories();
exit(0);
}
break;

default:
fprintf(stderr, "\n");
showHelp(argv[0]);
exit(-1);
break;
}
}

registerSigHandler();

if (g_initialSleepSecs > 0) {
sleep(g_initialSleepSecs);
}

bool ok = true;
/* (4) "-- async_start" option命令的实际执行动作 */
if (traceStart) {
/* (4.1) */
ok &= setUpTrace();

/* (4.2) */
ok &= startTrace();
}

if (ok && traceStart) {
if (!traceStream) {
printf("capturing trace...");
fflush(stdout);
}

// We clear the trace after starting it because tracing gets enabled for
// each CPU individually in the kernel. Having the beginning of the trace
// contain entries from only one CPU can cause "begin" entries without a
// matching "end" entry to show up if a task gets migrated from one CPU to
// another.
/* (4.3) 清除trace内容 */
ok = clearTrace();

/* (4.4) 通过trace_marker文件接口,写入同步信息 */
writeClockSyncMarker();

/* (4.5) async==false的支持 */
if (ok && !async && !traceStream) {
// Sleep to allow the trace to be captured.
struct timespec timeLeft;
timeLeft.tv_sec = g_traceDurationSeconds;
timeLeft.tv_nsec = 0;
do {
if (g_traceAborted) {
break;
}
} while (nanosleep(&timeLeft, &timeLeft) == -1 && errno == EINTR);
}

/* (4.6) traceStream的支持 */
if (traceStream) {
streamTrace();
}
}

// Stop the trace and restore the default settings.
/* (5) "-- async_stop" option命令的实际执行动作 */
if (traceStop)
stopTrace();

/* (6) "-- async_dump" option命令的实际执行动作 */
if (ok && traceDump) {
if (!g_traceAborted) {
printf(" done\n");
fflush(stdout);
int outFd = STDOUT_FILENO;
if (g_outputFile) {
outFd = open(g_outputFile, O_WRONLY | O_CREAT | O_TRUNC, 0644);
}
if (outFd == -1) {
printf("Failed to open '%s', err=%d", g_outputFile, errno);
} else {
dprintf(outFd, "TRACE:\n");
dumpTrace(outFd);
if (g_outputFile) {
close(outFd);
}
}
} else {
printf("\ntrace aborted.\n");
fflush(stdout);
}
clearTrace();
} else if (!ok) {
fprintf(stderr, "unable to start tracing\n");
}

// Reset the trace buffer size to 1.
if (traceStop)
cleanUpTrace();

return g_traceAborted ? 1 : 0;
}

3.1、categories

categories指的是可被trace的事件的类别,它的全集如下:

1
2
3
4
5
6
7
8
9
10
11
12
13
14
15
16
17
18
19
20
21
22
23
24
25
26
27
28
29
30
31
32
33
34
35
36
37
38
39
40
41
42
43
44
45
46
47
48
49
50
51
52
53
54
55
56
57
58
59
60
61
62
63
64
65
66
67
68
69
70
71
72
73
74
75
76
77
78
79
80
81
82
83
84
85
86
87
88
89
90
91
92
93
94
95
96
97
98
99
100
101
102
103
104
105
106
107
108
109
110
/* Tracing categories */
static const TracingCategory k_categories[] = {
{ "gfx", "Graphics", ATRACE_TAG_GRAPHICS, {
{ OPT, "events/mdss/enable" },
} },
{ "input", "Input", ATRACE_TAG_INPUT, { } },
{ "view", "View System", ATRACE_TAG_VIEW, { } },
{ "webview", "WebView", ATRACE_TAG_WEBVIEW, { } },
{ "wm", "Window Manager", ATRACE_TAG_WINDOW_MANAGER, { } },
{ "am", "Activity Manager", ATRACE_TAG_ACTIVITY_MANAGER, { } },
{ "sm", "Sync Manager", ATRACE_TAG_SYNC_MANAGER, { } },
{ "audio", "Audio", ATRACE_TAG_AUDIO, { } },
{ "video", "Video", ATRACE_TAG_VIDEO, { } },
{ "camera", "Camera", ATRACE_TAG_CAMERA, { } },
{ "hal", "Hardware Modules", ATRACE_TAG_HAL, { } },
{ "app", "Application", ATRACE_TAG_APP, { } },
{ "res", "Resource Loading", ATRACE_TAG_RESOURCES, { } },
{ "dalvik", "Dalvik VM", ATRACE_TAG_DALVIK, { } },
{ "rs", "RenderScript", ATRACE_TAG_RS, { } },
{ "bionic", "Bionic C Library", ATRACE_TAG_BIONIC, { } },
{ "power", "Power Management", ATRACE_TAG_POWER, { } },
{ "pm", "Package Manager", ATRACE_TAG_PACKAGE_MANAGER, { } },
{ "ss", "System Server", ATRACE_TAG_SYSTEM_SERVER, { } },
{ "database", "Database", ATRACE_TAG_DATABASE, { } },
{ "network", "Network", ATRACE_TAG_NETWORK, { } },
{ "adb", "ADB", ATRACE_TAG_ADB, { } },
{ k_coreServiceCategory, "Core services", 0, { } },
{ k_pdxServiceCategory, "PDX services", 0, { } },
{ "sched", "CPU Scheduling", 0, {
{ REQ, "events/sched/sched_switch/enable" },
{ REQ, "events/sched/sched_wakeup/enable" },
{ OPT, "events/sched/sched_waking/enable" },
{ OPT, "events/sched/sched_blocked_reason/enable" },
{ OPT, "events/sched/sched_cpu_hotplug/enable" },
{ OPT, "events/cgroup/enable" },
} },
{ "irq", "IRQ Events", 0, {
{ REQ, "events/irq/enable" },
{ OPT, "events/ipi/enable" },
} },
{ "i2c", "I2C Events", 0, {
{ REQ, "events/i2c/enable" },
{ REQ, "events/i2c/i2c_read/enable" },
{ REQ, "events/i2c/i2c_write/enable" },
{ REQ, "events/i2c/i2c_result/enable" },
{ REQ, "events/i2c/i2c_reply/enable" },
{ OPT, "events/i2c/smbus_read/enable" },
{ OPT, "events/i2c/smbus_write/enable" },
{ OPT, "events/i2c/smbus_result/enable" },
{ OPT, "events/i2c/smbus_reply/enable" },
} },
{ "freq", "CPU Frequency", 0, {
{ REQ, "events/power/cpu_frequency/enable" },
{ OPT, "events/power/clock_set_rate/enable" },
{ OPT, "events/power/cpu_frequency_limits/enable" },
} },
{ "membus", "Memory Bus Utilization", 0, {
{ REQ, "events/memory_bus/enable" },
} },
{ "idle", "CPU Idle", 0, {
{ REQ, "events/power/cpu_idle/enable" },
} },
{ "disk", "Disk I/O", 0, {
{ OPT, "events/f2fs/f2fs_sync_file_enter/enable" },
{ OPT, "events/f2fs/f2fs_sync_file_exit/enable" },
{ OPT, "events/f2fs/f2fs_write_begin/enable" },
{ OPT, "events/f2fs/f2fs_write_end/enable" },
{ OPT, "events/ext4/ext4_da_write_begin/enable" },
{ OPT, "events/ext4/ext4_da_write_end/enable" },
{ OPT, "events/ext4/ext4_sync_file_enter/enable" },
{ OPT, "events/ext4/ext4_sync_file_exit/enable" },
{ REQ, "events/block/block_rq_issue/enable" },
{ REQ, "events/block/block_rq_complete/enable" },
} },
{ "mmc", "eMMC commands", 0, {
{ REQ, "events/mmc/enable" },
} },
{ "load", "CPU Load", 0, {
{ REQ, "events/cpufreq_interactive/enable" },
} },
{ "sync", "Synchronization", 0, {
{ REQ, "events/sync/enable" },
} },
{ "workq", "Kernel Workqueues", 0, {
{ REQ, "events/workqueue/enable" },
} },
{ "memreclaim", "Kernel Memory Reclaim", 0, {
{ REQ, "events/vmscan/mm_vmscan_direct_reclaim_begin/enable" },
{ REQ, "events/vmscan/mm_vmscan_direct_reclaim_end/enable" },
{ REQ, "events/vmscan/mm_vmscan_kswapd_wake/enable" },
{ REQ, "events/vmscan/mm_vmscan_kswapd_sleep/enable" },
{ REQ, "events/lowmemorykiller/enable" },
} },
{ "regulators", "Voltage and Current Regulators", 0, {
{ REQ, "events/regulator/enable" },
} },
{ "binder_driver", "Binder Kernel driver", 0, {
{ REQ, "events/binder/binder_transaction/enable" },
{ REQ, "events/binder/binder_transaction_received/enable" },
{ OPT, "events/binder/binder_set_priority/enable" },
} },
{ "binder_lock", "Binder global lock trace", 0, {
{ OPT, "events/binder/binder_lock/enable" },
{ OPT, "events/binder/binder_locked/enable" },
{ OPT, "events/binder/binder_unlock/enable" },
} },
{ "pagecache", "Page cache", 0, {
{ REQ, "events/filemap/enable" },
} },
};

这些categories可以简单分为3类:

  • 1、使用内核ftrace的trace event实现的内核事件。例如”sched”,.sysfiles字段指定了trace event的路径;
  • 2、使用Trace类实现的用户态事件(app/java framework/native)。例如”input”,.tags字段指定了trace tag;
  • 3、service类型的事件。如k_coreServiceCategory和k_pdxServiceCategory;

具体目标机可能只支持categories全集中的一部分,所以atrace会对命令参数中指定的categories本机是否支持进行判断:

1
2
3
4
5
6
7
8
9
10
11
12
13
14
15
16
17
18
19
20
21
22
23
24
25
26
27
28
29
30
31
32
33
34
35
36
37
38
39
40
41
42
43
44
45
46
47
48
49
50
51
52
53
54
55
56
57
58
59
60
61
62
63
64
65
66
main() -> setCategoryEnable():

static bool setCategoryEnable(const char* name, bool enable)
{
/* (1) 逐个判断命令参数中的categories,本机是否支持 */
for (size_t i = 0; i < arraysize(k_categories); i++) {
const TracingCategory& c = k_categories[i];
if (strcmp(name, c.name) == 0) {

/* (2) 判断categories是否支持 */
if (isCategorySupported(c)) {
g_categoryEnables[i] = enable;
return true;
} else {
/* (3) 如果本机不支持categories,原因是否是没有root权限? */
if (isCategorySupportedForRoot(c)) {
fprintf(stderr, "error: category \"%s\" requires root "
"privileges.\n", name);

/* (4) 本机不支持categories,报错 */
} else {
fprintf(stderr, "error: category \"%s\" is not supported "
"on this device.\n", name);
}
return false;
}
}
}
fprintf(stderr, "error: unknown tracing category \"%s\"\n", name);
return false;
}


static bool isCategorySupported(const TracingCategory& category)
{
/* (2.1) 如果category是k_coreServiceCategory,判断name是否为"core_services",判断"ro.atrace.core.services"的property是否存在 */
if (strcmp(category.name, k_coreServiceCategory) == 0) {
return !android::base::GetProperty(k_coreServicesProp, "").empty();
}


/* (2.2) 如果category是k_pdxServiceCategory,判断name是否为"pdx" */
if (strcmp(category.name, k_pdxServiceCategory) == 0) {
return true;
}

bool ok = category.tags != 0;
/* (2.2) 如果category是使用了内核的trace event,判断trace4event相应的文件是否存在是否可写 */
for (int i = 0; i < MAX_SYS_FILES; i++) {
const char* path = category.sysfiles[i].path;
bool req = category.sysfiles[i].required == REQ;
if (path != NULL) {
if (req) {
if (!fileIsWritable(path)) {
return false;
} else {
ok = true;
}
} else {
ok = true;
}
}
}
return ok;
}

我们也可以使用atrace命令的”–list_categories”选项,列出当前目标机支持的所有categories:

1
2
3
4
5
6
7
8
9
10
11
12
13
14
main() -> listSupportedCategories():

static void listSupportedCategories()
{
/* (1) 逐个遍历k_categories数组中的所有category */
for (size_t i = 0; i < arraysize(k_categories); i++) {
const TracingCategory& c = k_categories[i];

/* (2) 判断当前目标机系统是否支持 */
if (isCategorySupported(c)) {
printf(" %10s - %s\n", c.name, c.longname);
}
}
}

3.2、’–async_start’

当atrace命令使用了’–async_start’选项以后,会启动指定的所有categories:

1
2
3
4
5
6
7
8
9
10
11
12
13
14
15
16
17
18
19
20
21
22
23
24
25
26
27
28
29
30
31
32
33
34
35
36
37
38
39
40
41
42
43
44
45
46
47
48
49
50
51
52
53
54
55
56
57
58
59
60
61
62
63
64
65
66
67
68
69
70
71
72
73
74
75
76
77
78
79
80
81
82
83
84
85
86
87
88
89
90
91
92
93
94
95
96
97
98
99
100
101
static bool setUpTrace()
{
bool ok = true;

// Set up the tracing options.
/* (4.1.1) 如果categories是使用文件指定的,解析文件中的categories并使能 */
ok &= setCategoriesEnableFromFile(g_categoriesFile);

/* (4.1.2) 根据'-c'选项,配置trace event的overwrite:"/sys/kernel/debug/tracing/options/overwrite" */
ok &= setTraceOverwriteEnable(g_traceOverwrite);

/* (4.1.3) 根据'-b'选项,配置trace event的buffer size:"/sys/kernel/debug/tracing/buffer_size_kb" */
ok &= setTraceBufferSizeKB(g_traceBufferSizeKB);
// TODO: Re-enable after stabilization
//ok &= setCmdlineSize();

/* (4.1.4) 根据选项,配置:"/sys/kernel/debug/tracing/trace_clock" */
ok &= setClock();

/* (4.1.5) 使能:"/sys/kernel/debug/tracing/options/print-tgid" */
ok &= setPrintTgidEnableIfPresent(true);

/* (4.1.6) 根据'-k'选项指定的需要trace的kernel 函数,
配置当前tracer为function_graph:"/sys/kernel/debug/tracing/current_tracer"
在filter中配置需要trace的函数名:"/sys/kernel/debug/tracing/set_ftrace_filter"
*/
ok &= setKernelTraceFuncs(g_kernelTraceFuncs);

// Set up the tags property.
uint64_t tags = 0;
/* (4.1.7) 把categories中需要trace的tag进行'或'操作,并配置到"debug.atrace.tags.enableflags"的property中 */
for (size_t i = 0; i < arraysize(k_categories); i++) {
if (g_categoryEnables[i]) {
const TracingCategory &c = k_categories[i];
tags |= c.tags;
}
}
ok &= setTagsProperty(tags);

bool coreServicesTagEnabled = false;
for (size_t i = 0; i < arraysize(k_categories); i++) {
if (strcmp(k_categories[i].name, k_coreServiceCategory) == 0) {
coreServicesTagEnabled = g_categoryEnables[i];
}

// Set whether to poke PDX services in this session.
if (strcmp(k_categories[i].name, k_pdxServiceCategory) == 0) {
g_tracePdx = g_categoryEnables[i];
}
}

/* (4.1.8) 根据'-a'选项指定的需要trace的app name,最多指定16个,
配置到"debug.atrace.app_%d"的property当中
*/
std::string packageList(g_debugAppCmdLine);
if (coreServicesTagEnabled) {
if (!packageList.empty()) {
packageList += ",";
}
packageList += android::base::GetProperty(k_coreServicesProp, "");
}
ok &= setAppCmdlineProperty(&packageList[0]);

/* (4.1.9) 让defaultServiceManager()中的所有service重新读取property,使修改的配置生效 */
ok &= pokeBinderServices();

/* (4.1.10) 让::android::hardware::defaultServiceManager()中的所有service重新读取property,使修改的配置生效 */
pokeHalServices();

/* (4.1.11) 如果categories指定了"pdx",让pdx service重新读取property,使修改的配置生效 */
if (g_tracePdx) {
ok &= ServiceUtility::PokeServices();
}

// Disable all the sysfs enables. This is done as a separate loop from
// the enables to allow the same enable to exist in multiple categories.
/* (4.1.12) disable掉所有的trace event */
ok &= disableKernelTraceEvents();

// Enable all the sysfs enables that are in an enabled category.
/* (4.1.13) 根据categories数组中的配置,使能相应的trace event */
for (size_t i = 0; i < arraysize(k_categories); i++) {
if (g_categoryEnables[i]) {
const TracingCategory &c = k_categories[i];
for (int j = 0; j < MAX_SYS_FILES; j++) {
const char* path = c.sysfiles[j].path;
bool required = c.sysfiles[j].required == REQ;
if (path != NULL) {
if (fileIsWritable(path)) {
ok &= setKernelOptionEnable(path, true);
} else if (required) {
fprintf(stderr, "error writing file %s\n", path);
ok = false;
}
}
}
}
}

return ok;
}
1
2
3
4
5
6
7
8
9
10
11
12
13
static bool startTrace()
{
return setTracingEnabled(true);
}


// Enable or disable kernel tracing.
static bool setTracingEnabled(bool enable)
{
/* (4.2.1) 打开总开关:"/sys/kernel/debug/tracing/tracing_on" */
return setKernelOptionEnable(k_tracingOnPath, enable);
}

3.3、’–async_dump’

当atrace命令使用了’–async_dump’选项以后,会dump出trace内容:

1
2
3
4
5
6
7
8
9
10
11
12
13
14
15
16
17
18
19
20
21
22
23
24
25
26
27
28
29
30
31
32
33
34
35
36
37
38
39
main()
{

/* (6) "-- async_dump" option命令的实际执行动作 */
if (ok && traceDump) {
if (!g_traceAborted) {
printf(" done\n");
fflush(stdout);

/* (6.1) 默认的dump信息输出句柄 */
int outFd = STDOUT_FILENO;

/* (6.2) 使用'-o'选项指定的dump信息输出句柄 */
if (g_outputFile) {
outFd = open(g_outputFile, O_WRONLY | O_CREAT | O_TRUNC, 0644);
}
if (outFd == -1) {
printf("Failed to open '%s', err=%d", g_outputFile, errno);
} else {
dprintf(outFd, "TRACE:\n");

/* (6.3) 读出"/sys/kernel/debug/tracing/trace"的内容dump到输出句柄 */
dumpTrace(outFd);
if (g_outputFile) {
close(outFd);
}
}
} else {
printf("\ntrace aborted.\n");
fflush(stdout);
}
clearTrace();
} else if (!ok) {
fprintf(stderr, "unable to start tracing\n");
}

}


3.4、’–async_stop’

当atrace命令使用了’–async_stop’选项以后,会停止所有categories的trace信息抓取:

1
2
3
4
5
6
7
8
9
10
11
12
static void stopTrace()
{
setTracingEnabled(false);
}


static bool setTracingEnabled(bool enable)
{
/* (5.1) 关闭总开关:"/sys/kernel/debug/tracing/tracing_on" */
return setKernelOptionEnable(k_tracingOnPath, enable);
}

4、目标机Trace类的使用(java/c++)

atrace只是一个控制命令,实际的trace数据路径是这样分工的:

  • 1、内核trace信息,通过trace event记录到ftrace的buffer中;
  • 2、用户态(app/java framework/native)是通过使用Trace类来记录trace信息的,实际上是通过”/sys/kernel/debug/tracing/trace_marker”接口记录到内核ftracebuffer当中的。

我们查看atrace dump出来的原始信息,可以看到对应的”tracing_mark_write”字段:

1
2
3
4
ndroid.systemui-1856  ( 1856) [001] ...1 89888.553074: tracing_mark_write: S|1856|animator:alpha|62928891
ndroid.systemui-1856 ( 1856) [001] ...1 89888.553096: tracing_mark_write: F|1856|animator:alpha|62928891
ndroid.systemui-1856 ( 1856) [001] ...1 89888.553110: tracing_mark_write: S|1856|animator:scaleX|37096049
ndroid.systemui-1856 ( 1856) [001] ...1 89888.553131: tracing_mark_write: F|1856|animator:scaleX|37096049

这样内核态和用户态的trace数据最后都写入到了ftrace buffer当中,也实现了时间同步,最后通过”/sys/kernel/debug/tracing/trace”接口读出。

在用户态的各个层次是这样使用Trace类的:

4.1、app

1
2
3
import android.os.Trace;
Trace.beginSection(String sectionName)
Trace.EndSection()

详细例子可以参考:systrace

1
2
3
4
5
6
7
8
9
10
11
12
13
14
15
16
17
18
19
20
21
22
23
24
25
26
27
28
29
30
31
32
33
34
35
public class MyAdapter extends RecyclerView.Adapter<MyViewHolder> {
...
@Override
public MyViewHolder onCreateViewHolder(ViewGroup parent, int viewType) {
Trace.beginSection(&quot;MyAdapter.onCreateViewHolder&quot;);
MyViewHolder myViewHolder;
try {
myViewHolder = MyViewHolder.newInstance(parent);
} finally {
// In &#39;try...catch&#39; statements, always call <code><a href="/reference/android/os/Trace.html#endSection()">endSection()</a></code>
// in a &#39;finally&#39; block to ensure it is invoked even when an exception
// is thrown.
Trace.endSection();
}
return myViewHolder;
}</p>

<p>@Override
public void onBindViewHolder(MyViewHolder holder, int position) {
Trace.beginSection(&quot;MyAdapter.onBindViewHolder&quot;);
try {
try {
Trace.beginSection(&quot;MyAdapter.queryDatabase&quot;);
RowItem rowItem = queryDatabase(position);
mDataset.add(rowItem);
} finally {
Trace.endSection();
}
holder.bind(mDataset.get(position));
} finally {
Trace.endSection();
}
}
...
}

然后通过python systrace.py –app=sectionName 指定apk,或者通过ddms选择指定apk,抓取systrace分析。

4.2、Java framework

1
2
3
import android.os.Trace;
Trace.traceBegin(long traceTag, String methodName)
Trace.traceEnd(long traceTag)

4.3、Native framework

1
2
#include <cutils/trace.h>
ATRACE_CALL()

5、主机Trace-Viewer的实现(js)

从systrace python文件的解析我们可以看到,最后把trace数据和’prefix.html’、’suffix.html’、’systrace_trace_viewer.html’合成一个’trace.html’文件,使用chrome浏览器打开’trace.html’就可以非常方便的以图形化的形式来查看和分析trace数据。

这里面的关键就是Trace-Viewer,核心是其中的js脚本。该项目的github主页

本人js功底太差,看了一堆资料还是不得要领。如有感兴趣的同学可以继续深入研究,Trace-Viewer功能非常强大,用来做trace数据的分析和实现再合适不过了,如果可以利用起来自己修改非常强大。

一些参考文档:
catapult on github
Trace-Viewer
Trace Event Format
extending-and-customizing-trace-viewer
Trace Viewer getting-started
Trace Viewer doc

和 Polymer 一起加入 Web 组件革命
The Trace Event Profiling Tool (about:tracing)
Recording Tracing Runs
Understanding about:tracing results
FrameViewer How-To

这里面最有名的一个问题是在trace.html中加上一条自定义的trace曲线,主要步骤如下:

  • 1、在内核中实现自己的trace event;
  • 2、在atrace.cpp代码的k_categories[]数组中加上对应的category;
  • 3、在Trace-Viewer中加上对这类category的解析,Trace-Viewer对数据的解析都是通过parser来实现的,可以仿照linux_perf中的实现增加一条parser,重新生成’systrace_trace_viewer.html’、’trace.html’文件即可。

参考文档

1、systrace
2、Android系统性能调优工具介绍
3、理解和使用systrace