从前面几章看:trace event使用静态tracepoint插桩,function tracer使用“bl _mcount”的插桩点来动态插桩。既然都是插桩,为什么我们不使用功能强大的kprobe机制?
kprobe event就是这样的产物。krpobe event和trace event的功能一样,但是因为它采用的是kprobe插桩机制,所以它不需要预留插桩位置,可以动态的在任何位置进行插桩。开销会大一点,但是非常灵活,是一个非常方便的补充机制。
1、函数插桩
1.1、插桩原理
kprobe的主要原理是使用“断点异常”和“单步异常”两种异常指令来对任意地址进行插桩,在此基础之上实现了三种机制:
- kprobe。可以被插入到内核的任何指令位置,在被插入指令之前调用kp.pre_handler(),在被插入指令之后调用kp.post_handler();
- jprobe。只支持对函数进行插入。
- kretprobe。和jprobe类似,机制略有不同,会替换被探测函数的返回地址,让函数先执行插入的钩子函数,再恢复。
具体的kprobe原理可以参考:Linux kprobe(内核探针 x86)。
需要注意的是arm64在kernel 4.9版本以后才支持kprobe。
1.2、kprobe event的使用
kprobe event的使用指南可以参考:kprobe event的使用。简单描述如下:
- 1、可以向“/sys/kernel/debug/tracing/kprobe_events”文件中echo命令的形式来创建krpobe event。新的event创建成功后,可以在“/sys/kernel/debug/tracing/events/”文件夹下看到新的“subsystem/event”,操作方法和普通event一样。
- 2、命令格式为:
1 | p[:[GRP/]EVENT] [MOD:]SYM[+offs]|MEMADDR [FETCHARGS] : Set a probe |
- 3、实例,在do_sys_open()函数之上创建一个kprobe,对应的“myprobe” event用来记录4个参数的:
1 | echo 'p:myprobe do_sys_open dfd=%ax filename=%dx flags=%cx mode=+4($stack)' > /sys/kernel/debug/tracing/kprobe_events |
创建成功后,可以通过“ /sys/kernel/debug/tracing/events/kprobes//format”查看event的输出格式:
1 | cat /sys/kernel/debug/tracing/events/kprobes/myprobe/format |
需要其工作的时候,enable对应的event:
1 | echo 1 > /sys/kernel/debug/tracing/events/kprobes/myprobe/enable |
还在do_sys_open()函数非返回点设置了一个kretprobe,对应的“myretprobe” event用来记录返回值:
1 | echo 'r:myretprobe do_sys_open $retval' >> /sys/kernel/debug/tracing/kprobe_events |
1.3、kprobe event的创建
krpobe event和trace event的功能一样,那么大部分的实现是一样的,最关键的不同就是怎么使用新的插桩方法来创建event。使用向“/sys/kernel/debug/tracing/kprobe_events”文件中echo命令的形式来创建krpobe event。
我们来查看具体的代码实现:
1 | entry = tracefs_create_file("kprobe_events", 0644, d_tracer, |
kprobe event被创建成功以后,系统处在这样一个状态:
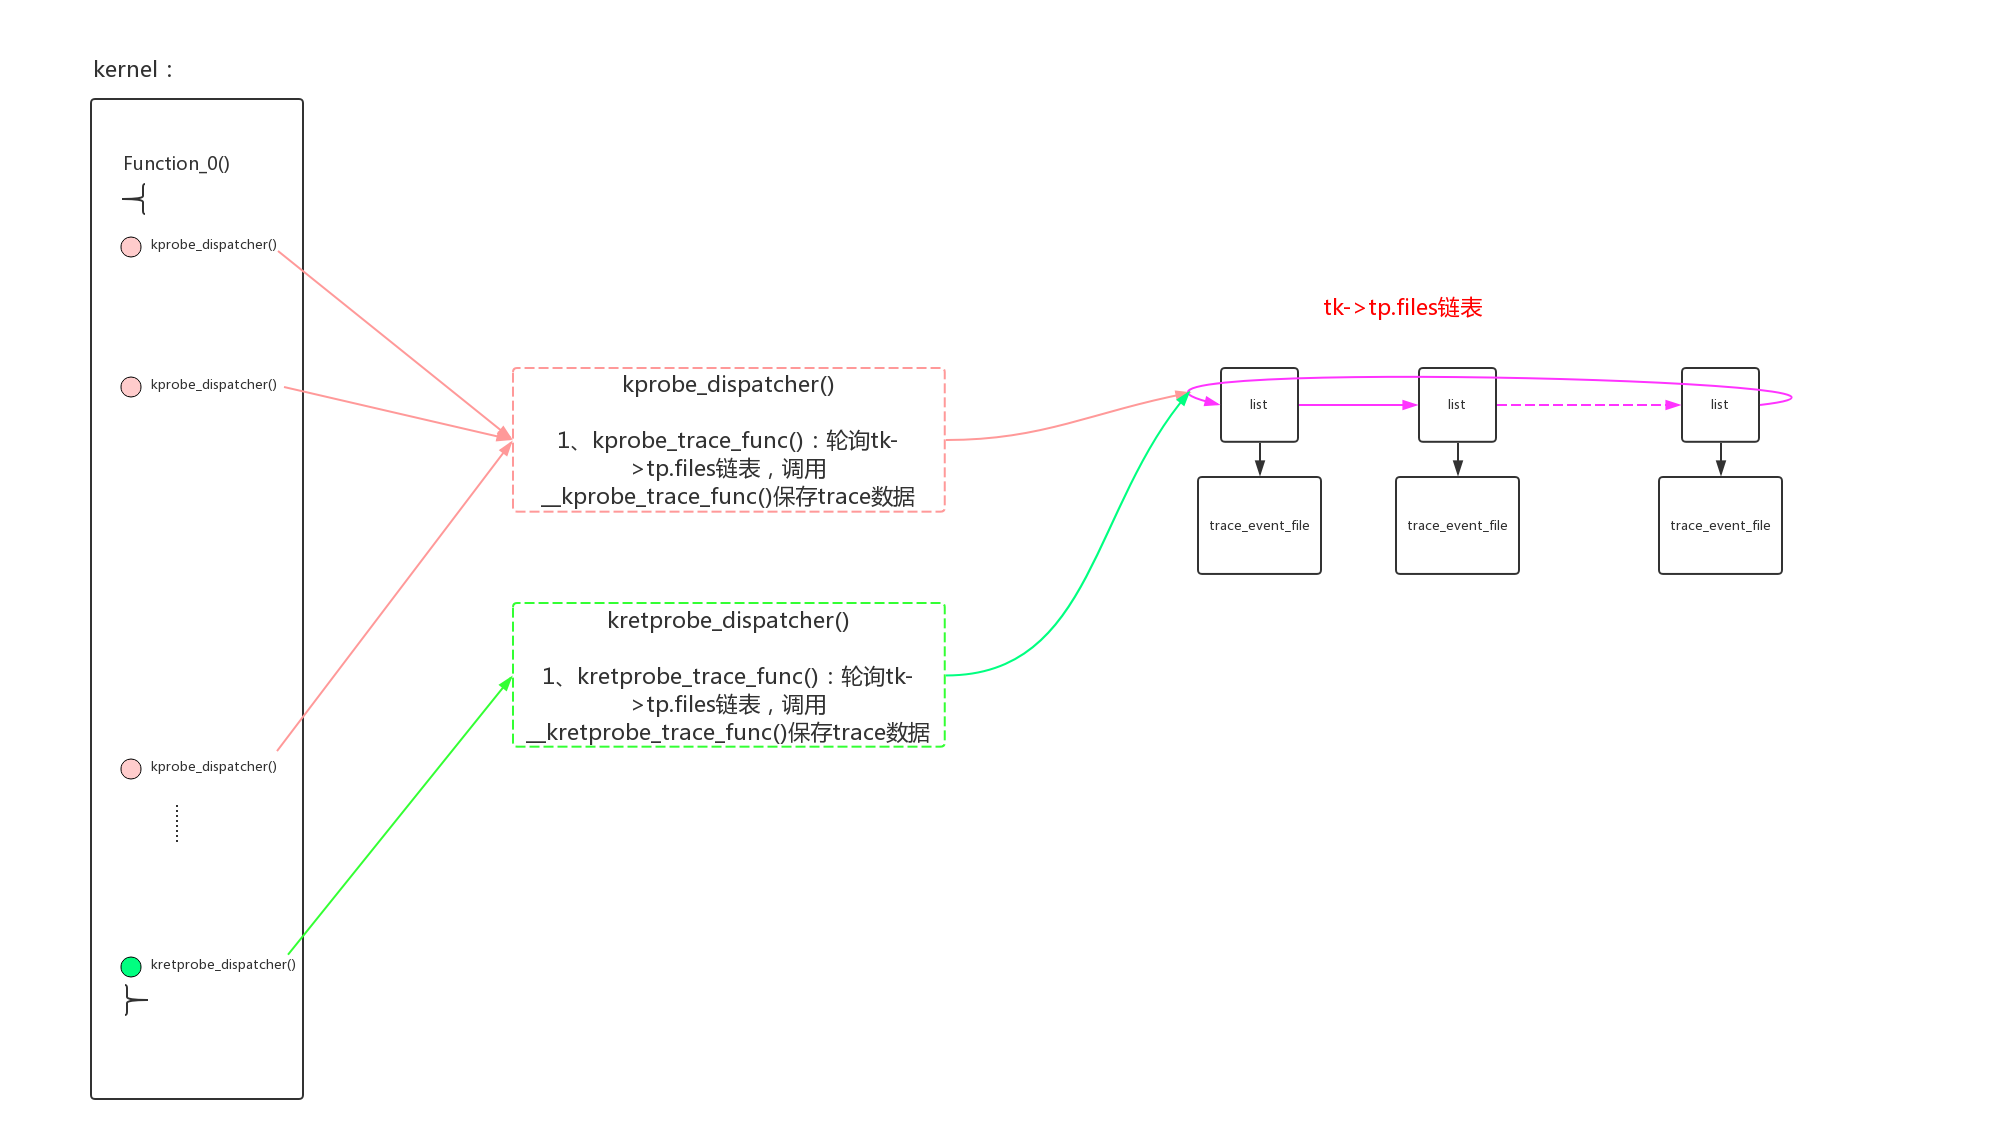
- 1、kprobe/kretprobe的探测点被插桩,桩函数为kprobe_dispatcher()/kretprobe_dispatcher()。桩函数等待着轮询tk->tp.files链表,把trace数据存到对应的ringbuffer当中;
- 2、trace_event_call已经注册,并且创建了trace_event_file把trace_event_call和trace_array中的ring buffer联系了起来;
但是此时,上述两步还没有建立起关系,tk->tp.files链表还是为空。
在enable event的操作中,最后会调用call->class->reg即kprobe_register()函数,把trace_event_file加入到tk->tp.files链表。至此整个数据通道贯通,桩函数会进行trace数据的抓取。
1.4、kprobe event的enable
event enable的执行路径为:ftrace_enable_fops -> event_enable_write() -> ftrace_event_enable_disable() -> __ftrace_event_enable_disable() -> call->class->reg(call, TRACE_REG_UNREGISTER/TRACE_REG_REGISTER, file);
kprobe event的call->class->reg()为kprobe_register():
1 | static int kprobe_register(struct trace_event_call *event, |
2、数据存入
kprobe event的数据存入路径为:kprobe_dispatcher() -> kprobe_trace_func() -> __kprobe_trace_func():
1 | /* Kprobe handler */ |
kretprobe event的数据存入路径为:kretprobe_dispatcher() -> kretprobe_trace_func() -> __kretprobe_trace_func():
1 | /* Kretprobe handler */ |
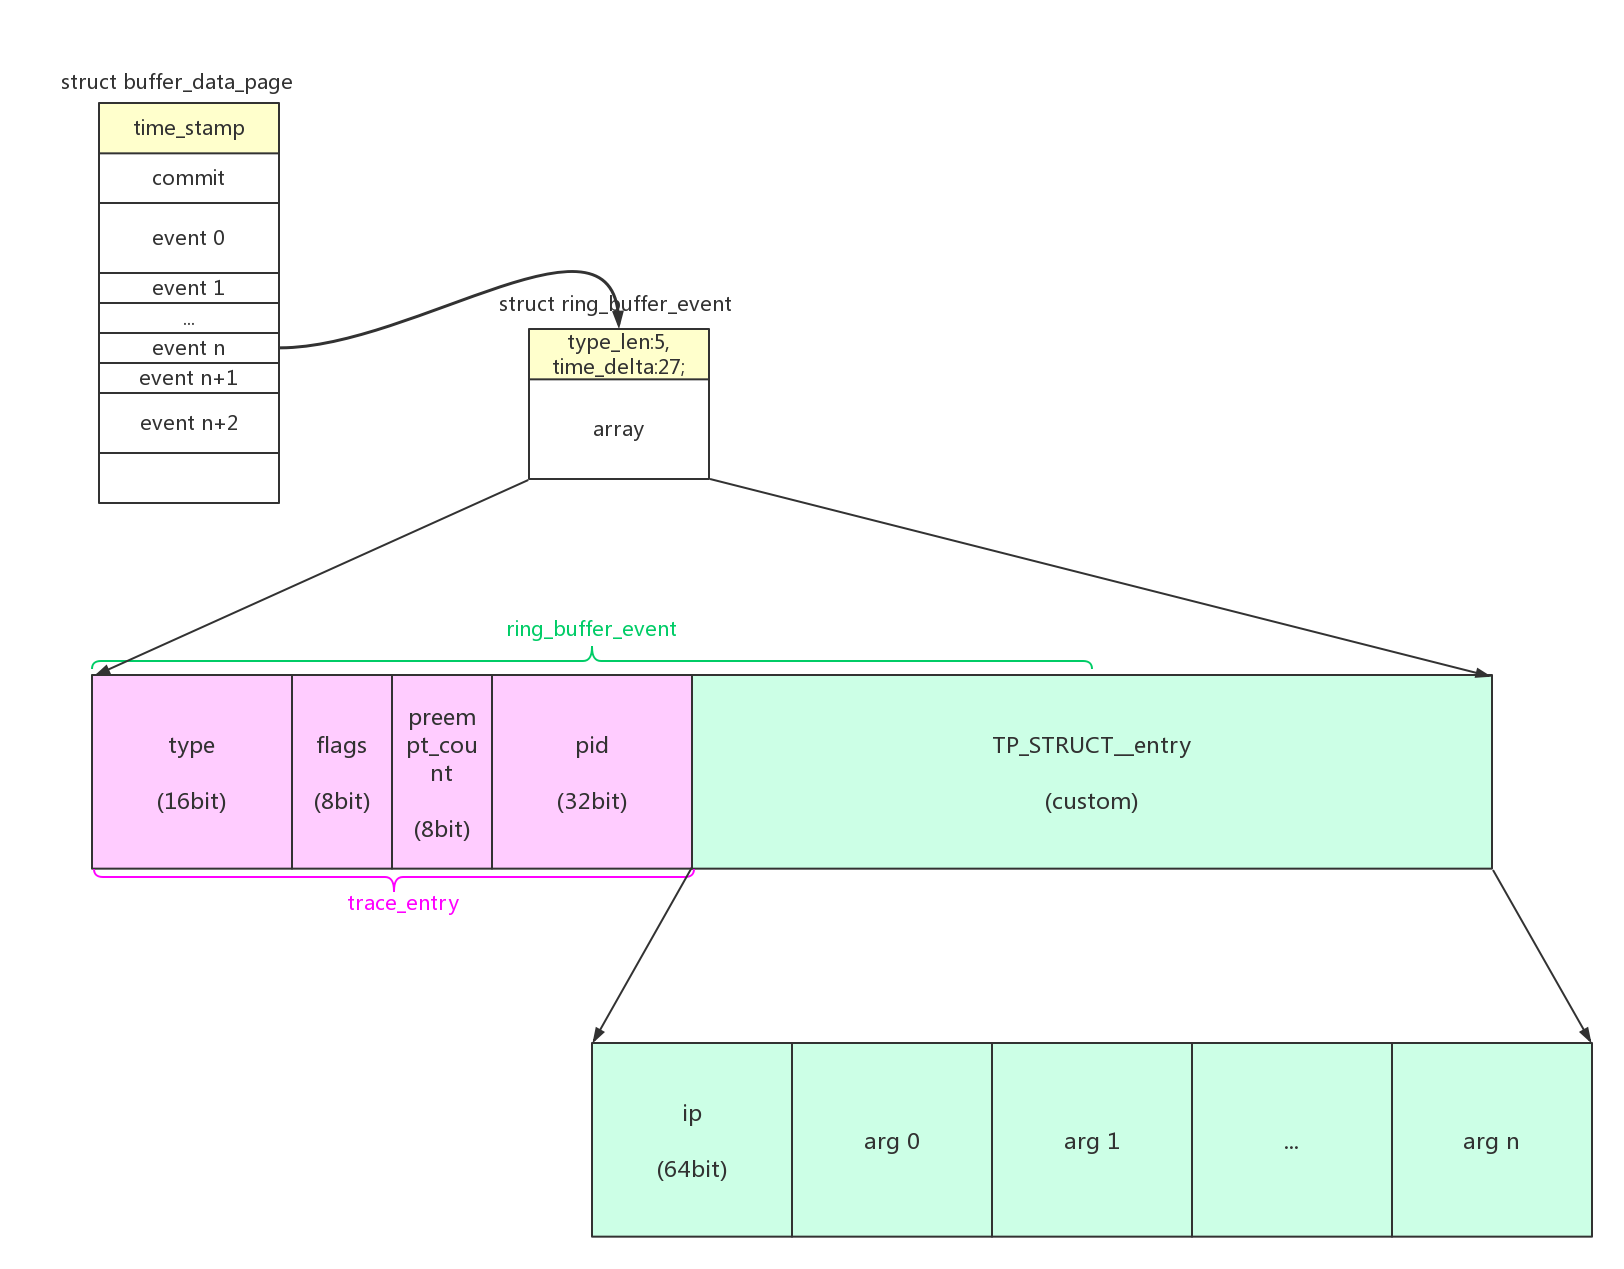
2.1、数据格式
kprobe event的数据格式为:
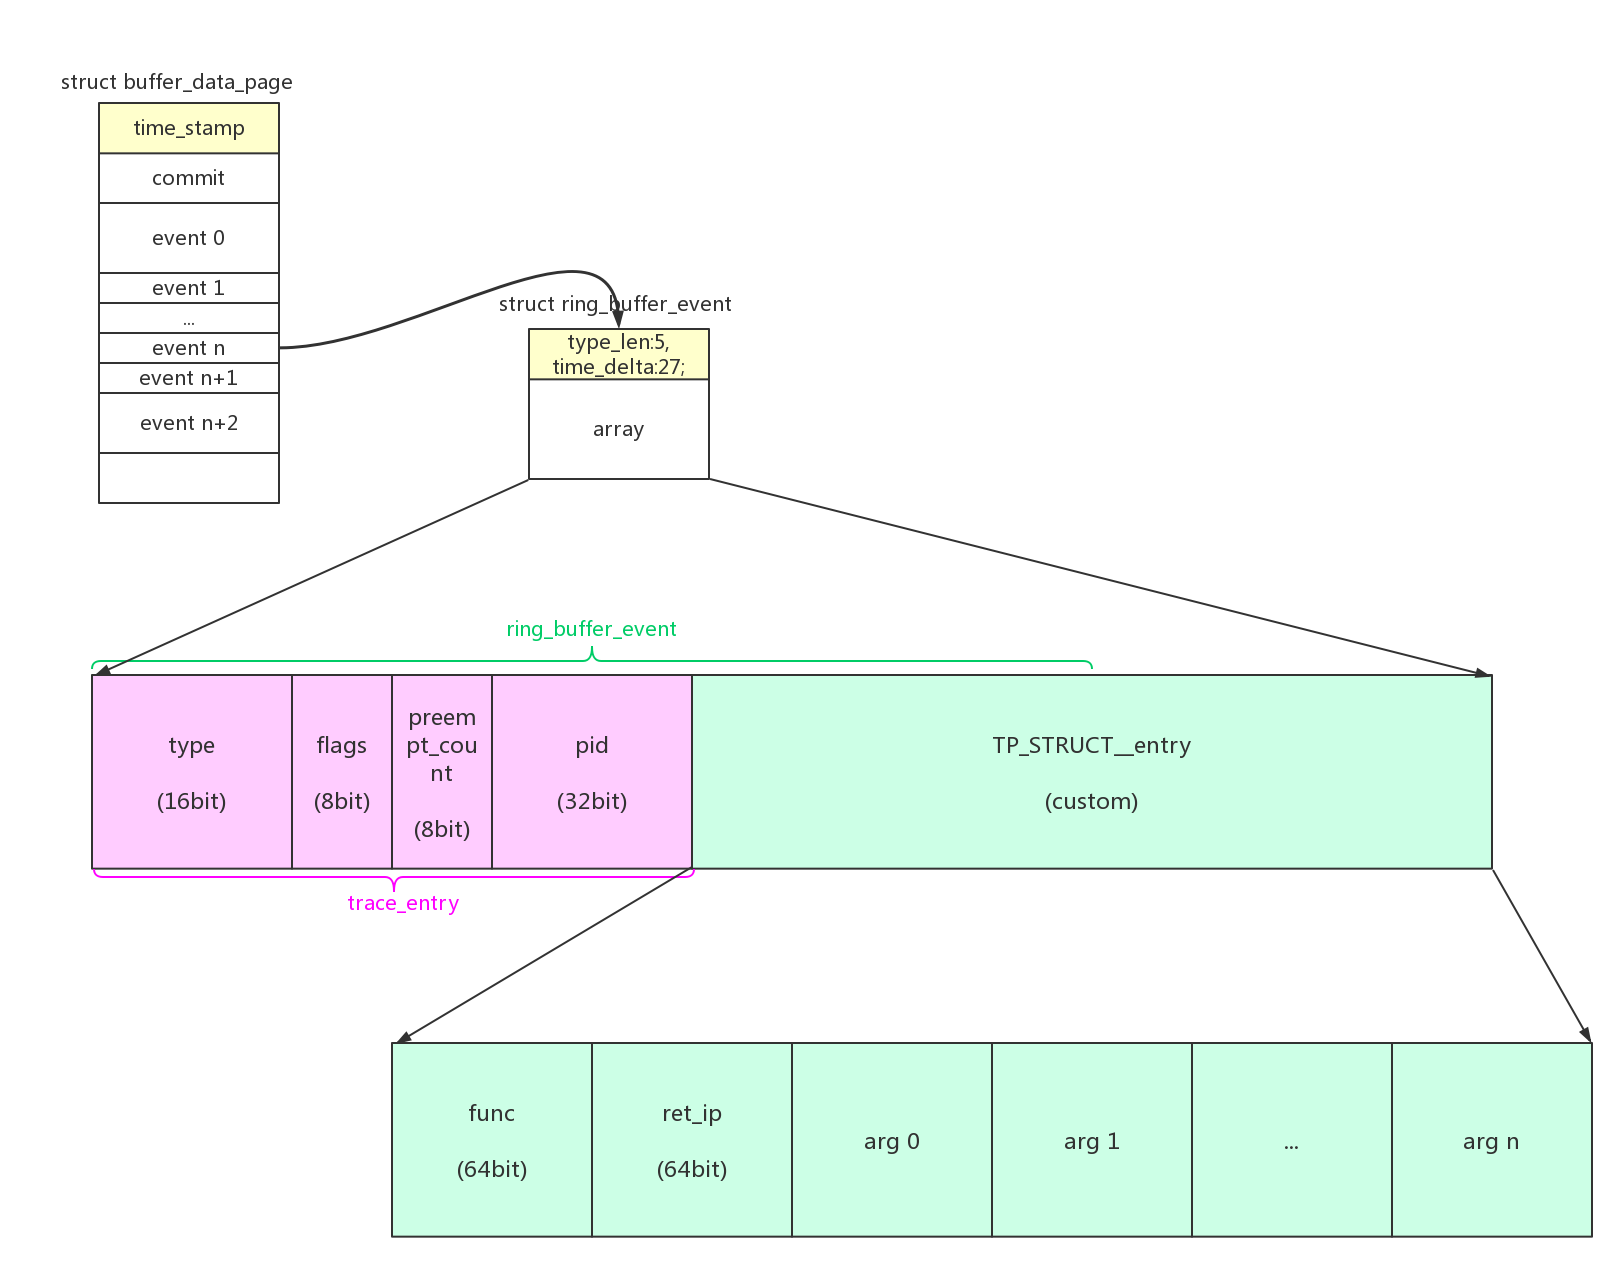
kretprobe event的数据格式为:
2.2、filter
trigger、filter和普通的trace event操作一致,请参考:trace event
3、数据读出
从trace文件读出的kprobe event数据格式为:
1 | cat /sys/kernel/debug/tracing/trace |
在register_kprobe_event()中,对kprobe模式的event.funcs赋值kprobe_funcs,对kretprobe模式的event.funcs赋值kretprobe_funcs:
1 | static int register_kprobe_event(struct trace_kprobe *tk) |
在数据读出时,会调用到event对应的event->funcs->trace()函数,seq_read() -> s_show() -> print_trace_line() -> print_trace_fmt() -> event->funcs->trace():
kprobe模式对应print_kprobe_event():
1 | /* Event entry printers */ |
kretprobe模式对应print_kretprobe_event():
1 | static enum print_line_t |