如trace event一章的描述,任何一种trace都离不开以下流程:
- 函数插桩。使用各种插桩方式把自己的trace函数插入到需要跟踪的probe point上;
- input trace数据。在trace的probe函数被命中时,会存储数据到ringbuffer当中;这里还包括filter和trigger功能;
- ouput trace数据。用户或者程序需要读出trace数据,根据需要输出ram数据或者是方面用户阅读的数据;对数据的解析,遵循谁存储谁提供解析规则的原则;
以function tracer为首的tracer也遵循同样的流程。
1、fucntion tracer
function tracer最大的难点在于:dynamic ftrace时(如不做说明本文默认dynamic)对大量插桩点的管理。
1 | root:/d/tracing # cat available_filter_functions | wc -l |
可以看到上述一个普通的系统,function tracer的插桩点为49099个,trace event的插桩点为987个。function tracer的插桩点几乎大于trace event插桩点两个数量级,而且trace event的插桩点是每一个插桩点都是独立控制的,而function tracer的插桩点默认是一起控制的(也可以通过set_ftrace_filter、set_ftrace_notrace来分开控制)。
这么庞大的数量的插桩点。如果独立控制会消耗大量的内存,如果集中控制又怎么能实现部分的filter和command控制?一旦桩函数的实现不简洁,开销会迅速放大。对这部分感兴趣可以直接跳转到1.2.2、插桩点的动态管理。
1.1、插桩原理
1.1.1、_mcount()
众所周知function trace是利用_mcount()函数进行插桩的。在gcc使用了“-pg”选项以后,会在每个函数的入口插入以下语句:
1 | function: |
默认的_mcount函数是空操作:
1 | ENTRY(_mcount) |
每个函数入口插入对_mcount()函数的调用,就是gcc提供的插桩机制。我们可以重新定义_mcount()函数中的内容,调用想要执行的内容。
1.1.2、static ftrace插桩
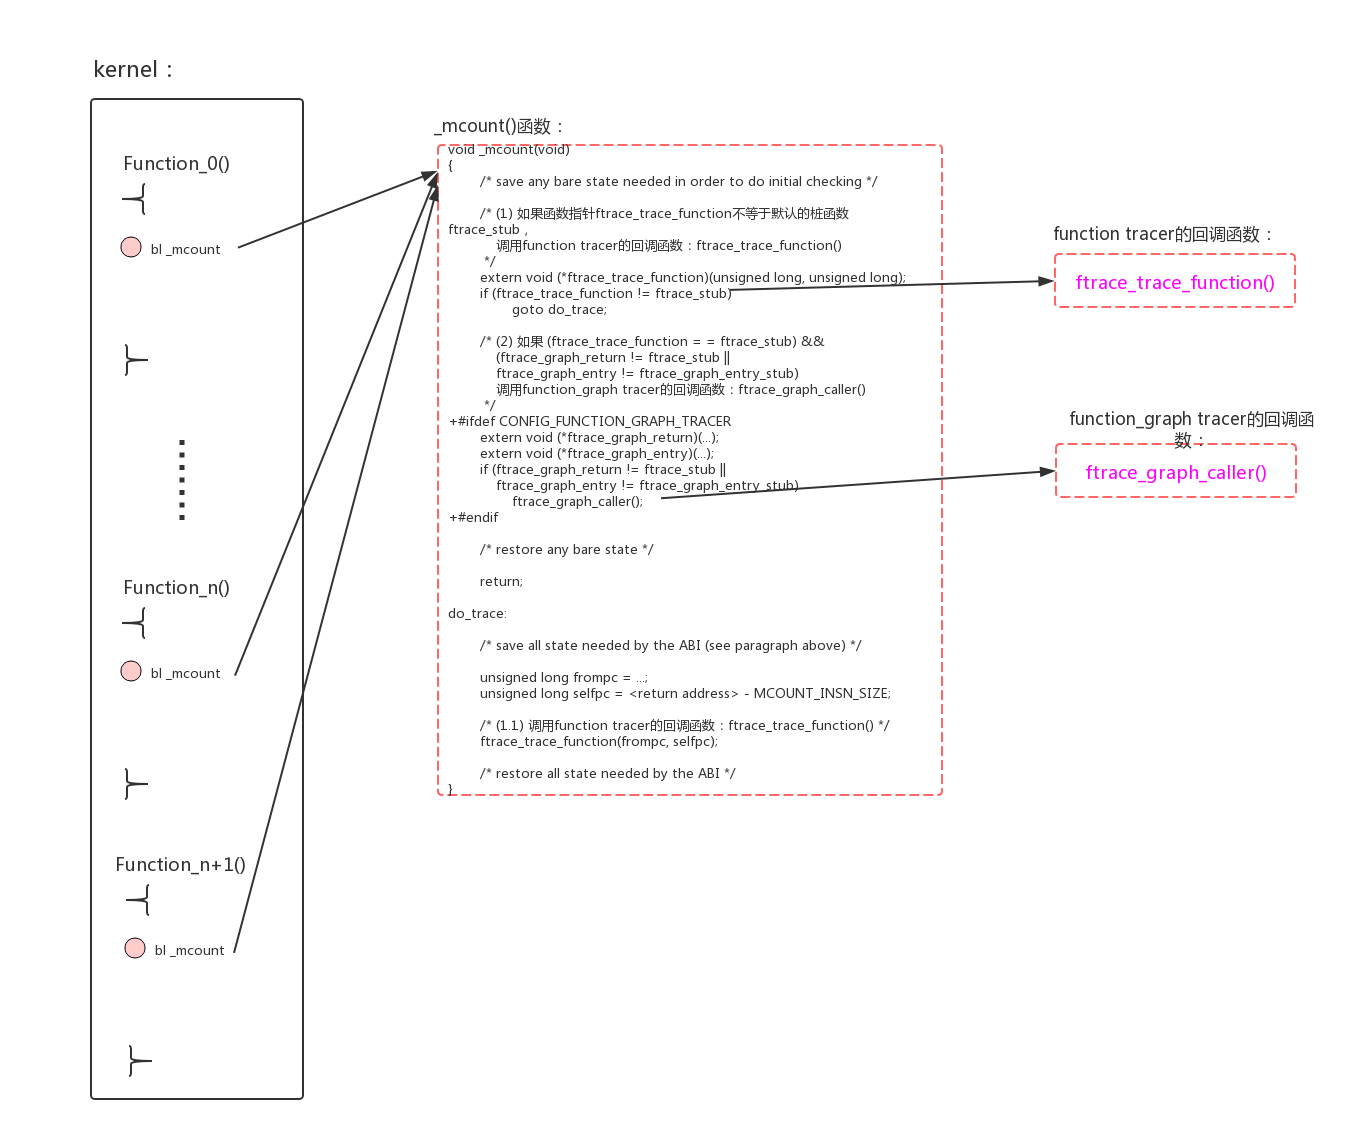
static ftrace就是使用重定义_mcount()函数的方法来实现插桩的:
arch/arm64/kernel/entry-ftrace.S:
1 | #ifndef CONFIG_DYNAMIC_FTRACE |
对应的伪代码如下:
1 | void _mcount(void) |
问:static ftrace下,怎么保准notrace的函数不被跟踪?
1.1.3、dynamic ftrace插桩
static ftrace一旦使能,对kernel中所有的函数(除开notrace、online、其他特殊函数)进行插桩,这带来的性能开销是惊人的,有可能导致人们弃用ftrace功能。
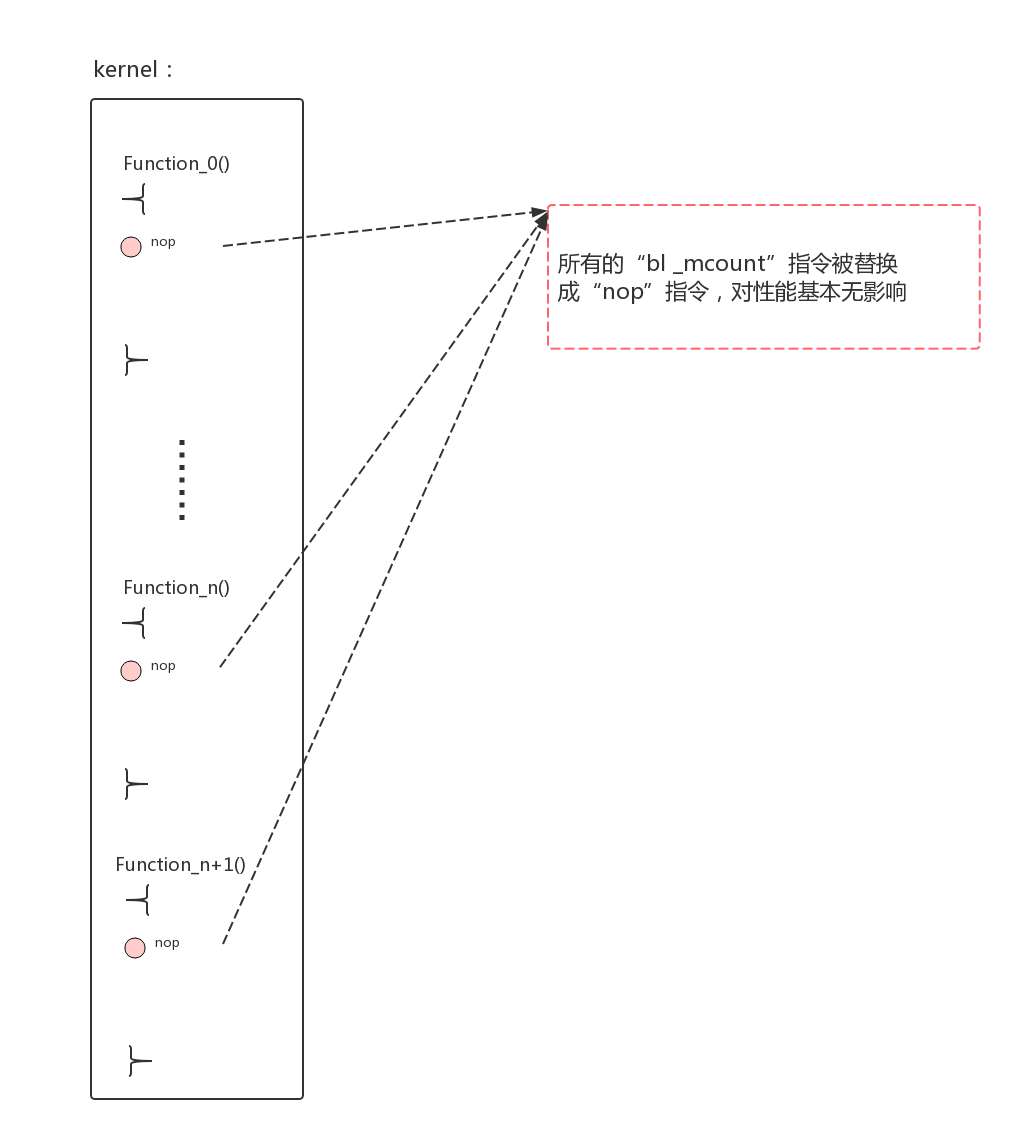
为了解决这个问题,内核开发者推出了dynamic ftrace。因为实际上调试者一般不需要对所有函数进行追踪,只会对感兴趣的一部分函数进行追踪。dynamic ftrace把不需要追踪的函数入口处指令“bl _mcount”替换成“nop”,这样基本对性能无影响;对需要追踪的函替换入口处“bl _mcount”为需要调用的函数。
1、ftrace在初始化时,根据编译时“scripts/recordmcount.pl”脚本记录的所有函数入口处插桩位置的“bl _mcount”,将其替换成“nop”指令:
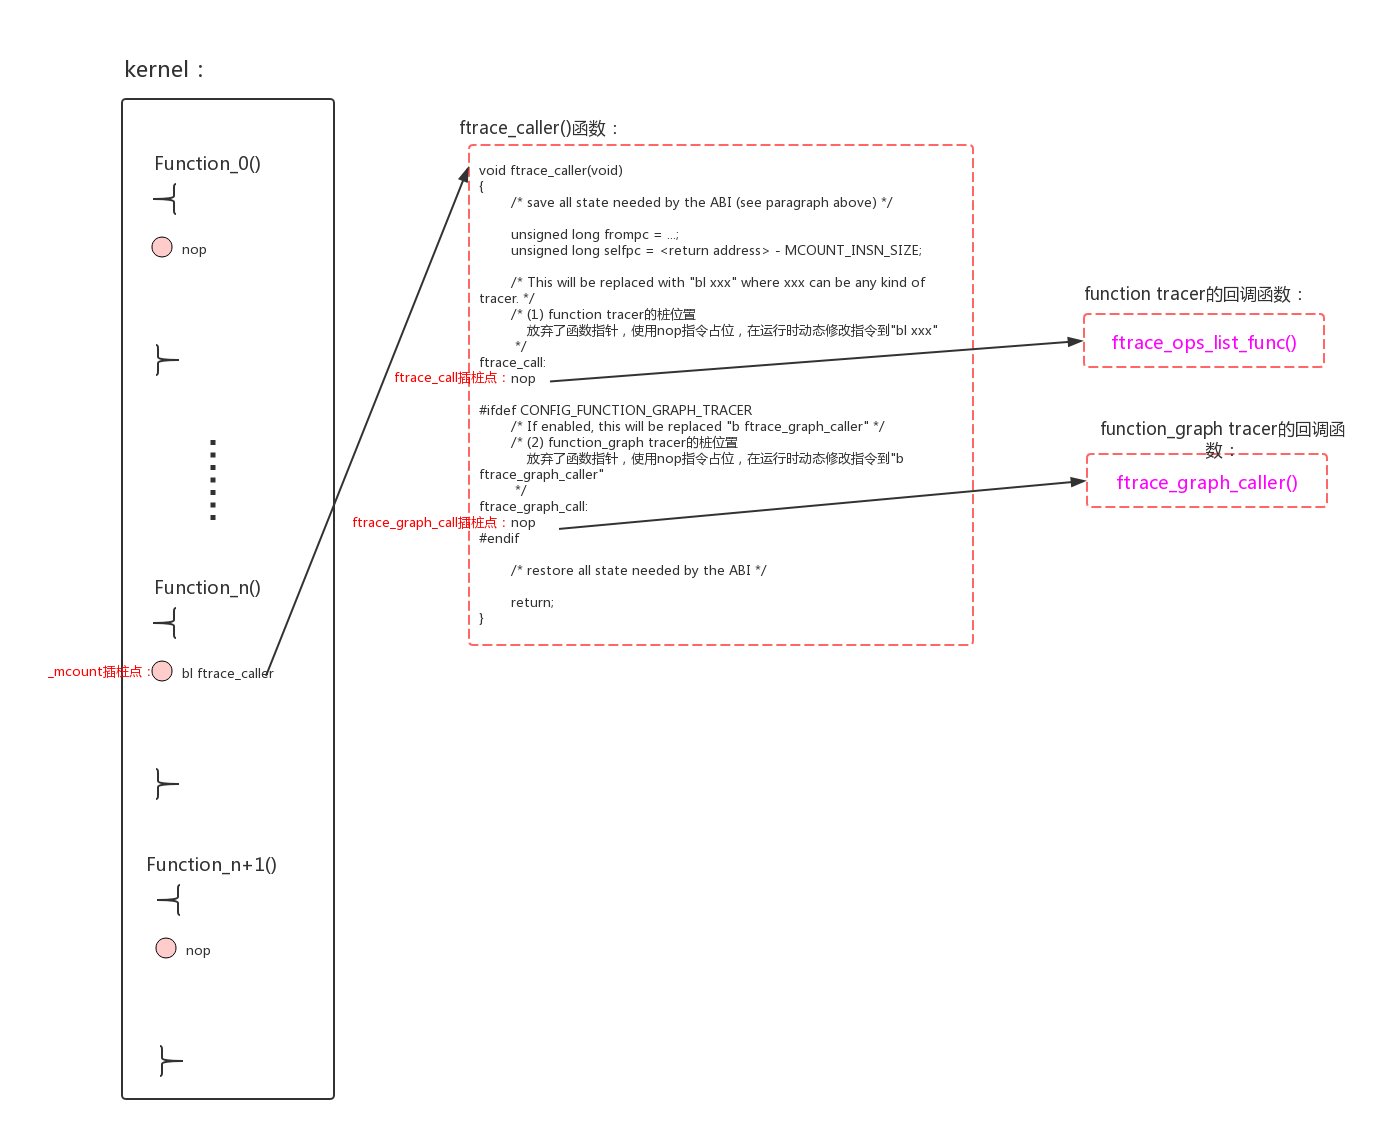
2、在tracer enable的时候,把需要跟踪的函数的插桩位置“nop”替换成“bl ftrace_caller”。
为什么不使用“bl _mcount”?主要原因是开发者不喜欢在_mcount()中使用宏来区分两种情况,索性重新创建一个新函数ftrace_caller()。
arch/arm64/kernel/entry-ftrace.S:
1 | #ifndef CONFIG_DYNAMIC_FTRACE |
对应的伪代码为:
1 | void ftrace_caller(void) |
1.2、插桩点管理
1.2.1、插桩点的初始化
1、在编译的时候调用recordmcount.pl搜集所有_mcount()函数的调用点,并且所有的调用点地址保存到section __mcount_loc。
include/asm-generic/vmlinux.lds.h:
1 | #ifdef CONFIG_FTRACE_MCOUNT_RECORD |
并没有详细去研究其原理,感兴趣可以具体研究一下“scripts/recordmcount.pl、scripts/recordmcount.c”。
2、在初始化时,遍历section __mcount_loc的调用点地址,默认给所有“bl _mcount”替换成“nop”。
kernel/trace/ftrace.c:
1 | void __init ftrace_init(void) |
1.2.2、插桩点的动态管理
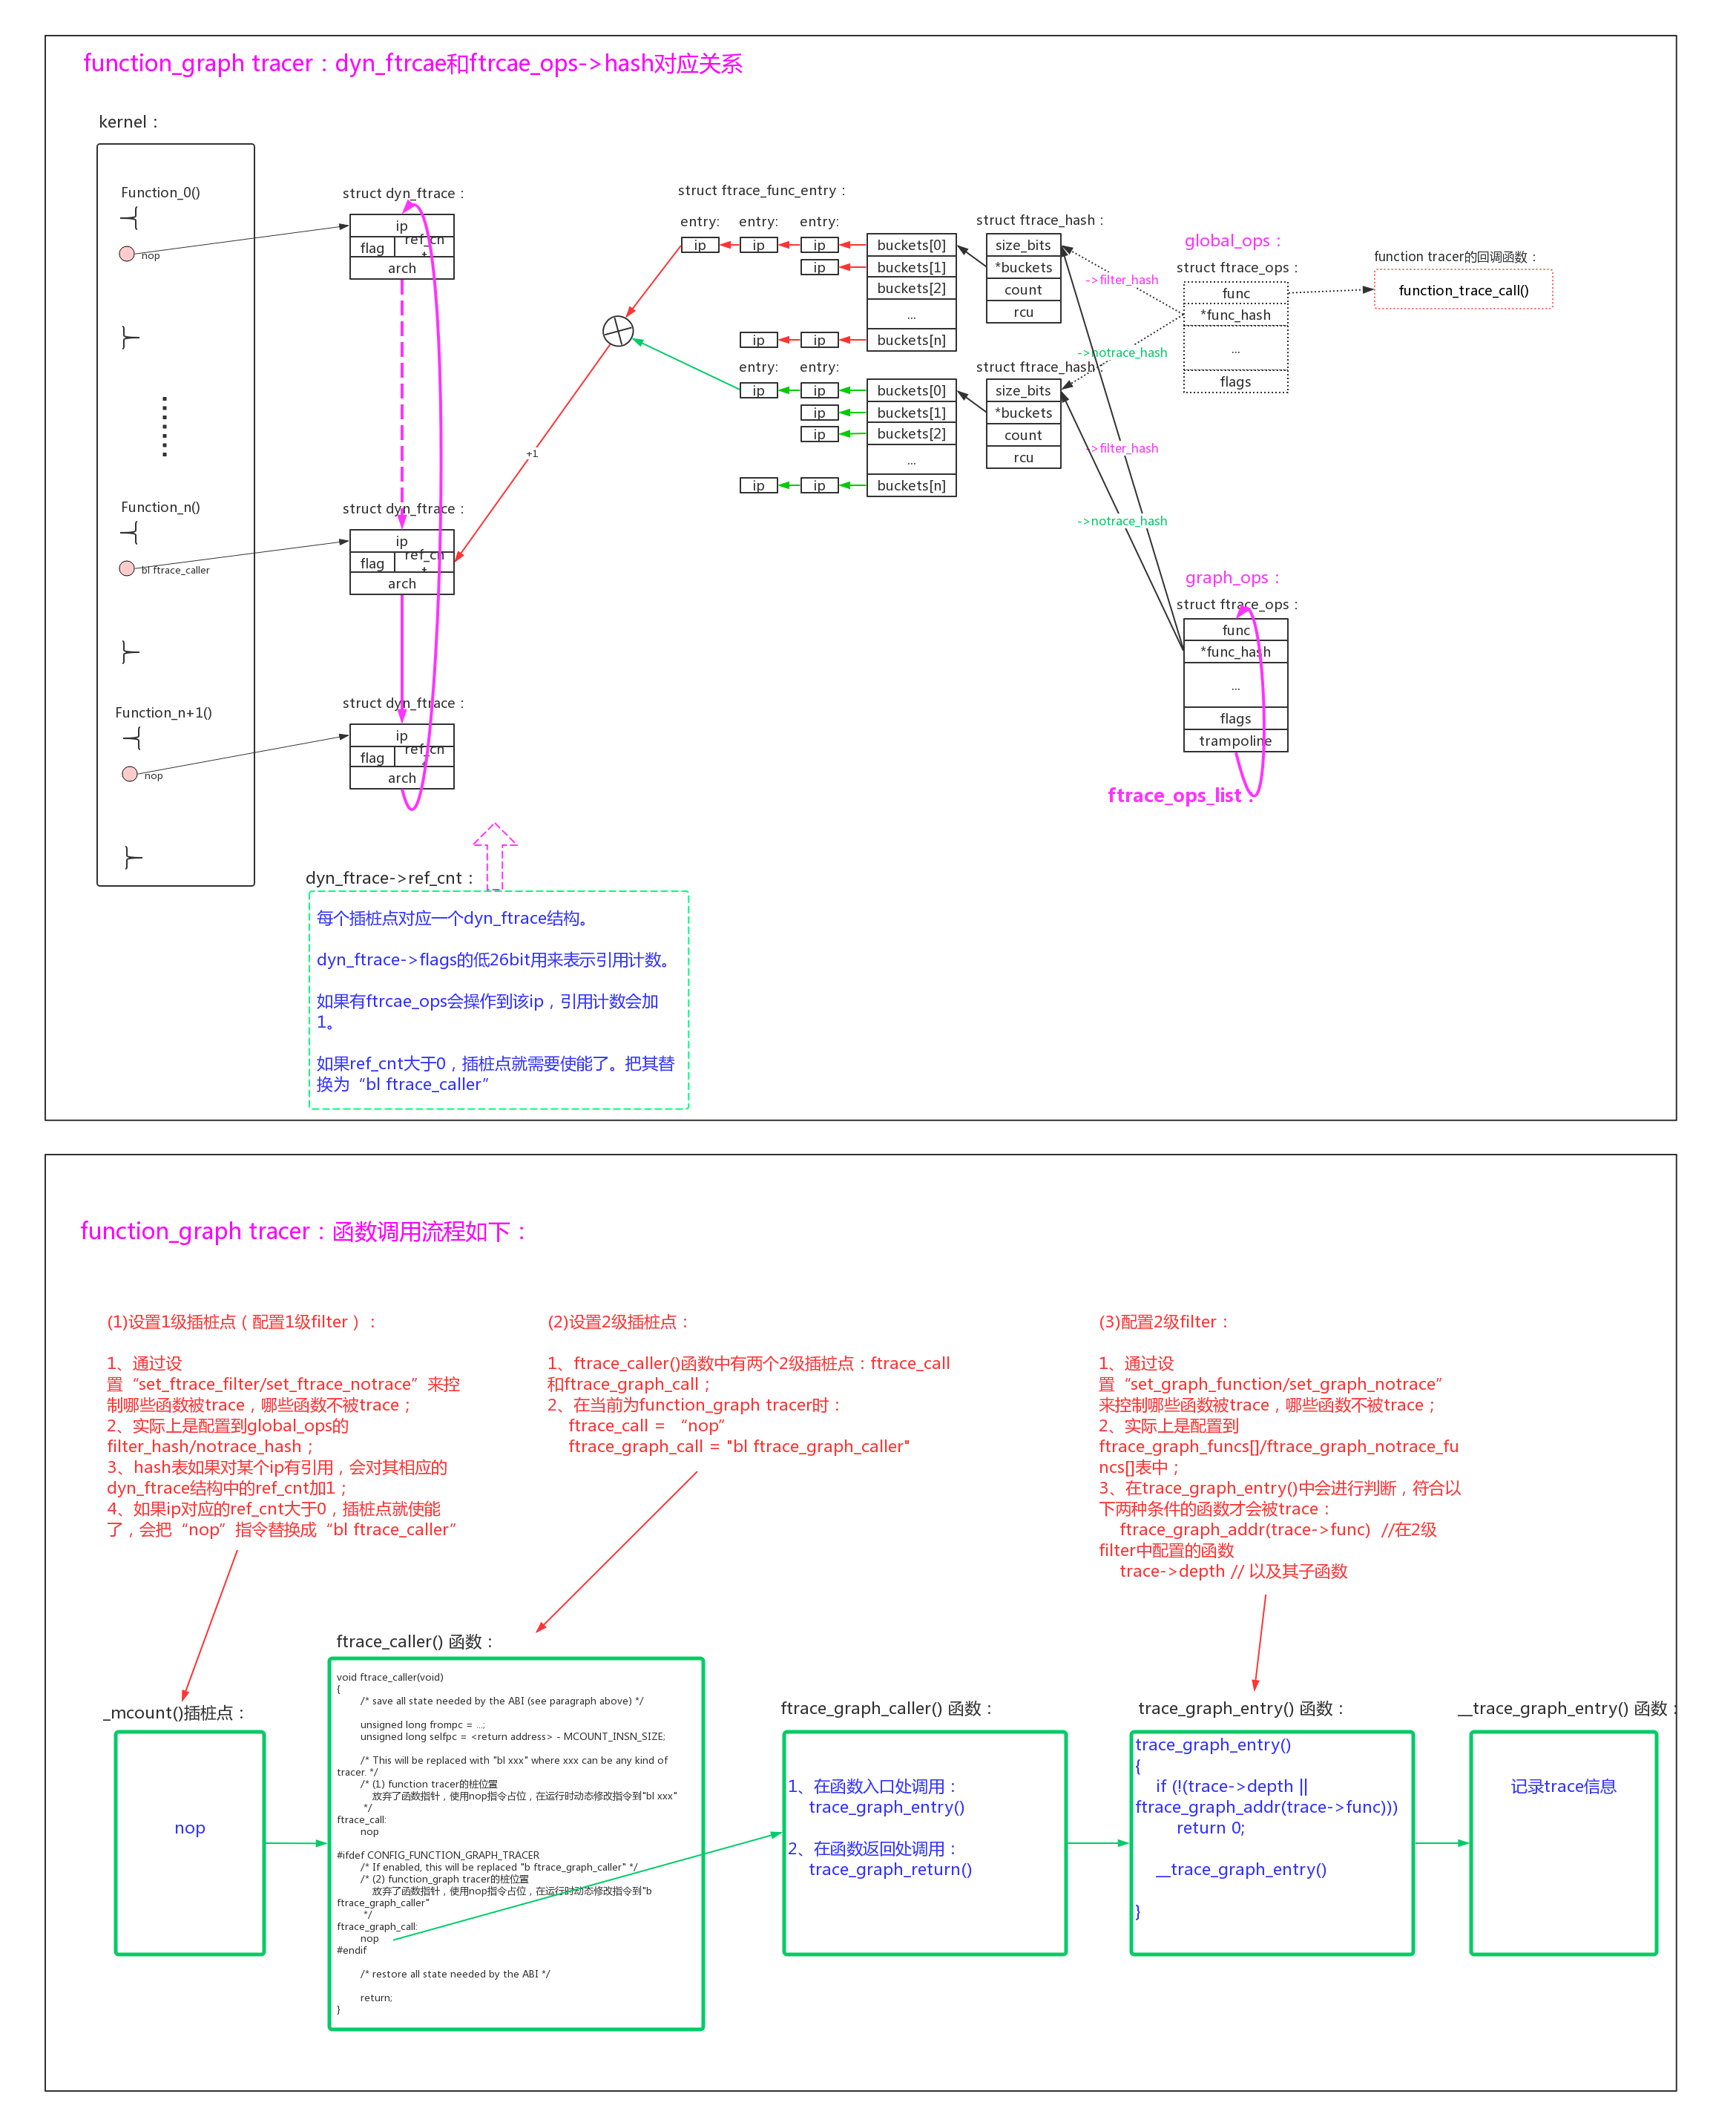
为了应对本文最开始处提出的难题,内核使用了插桩点控制链表+命令hash表的形式。
function tracer插桩点动态管理的原理:
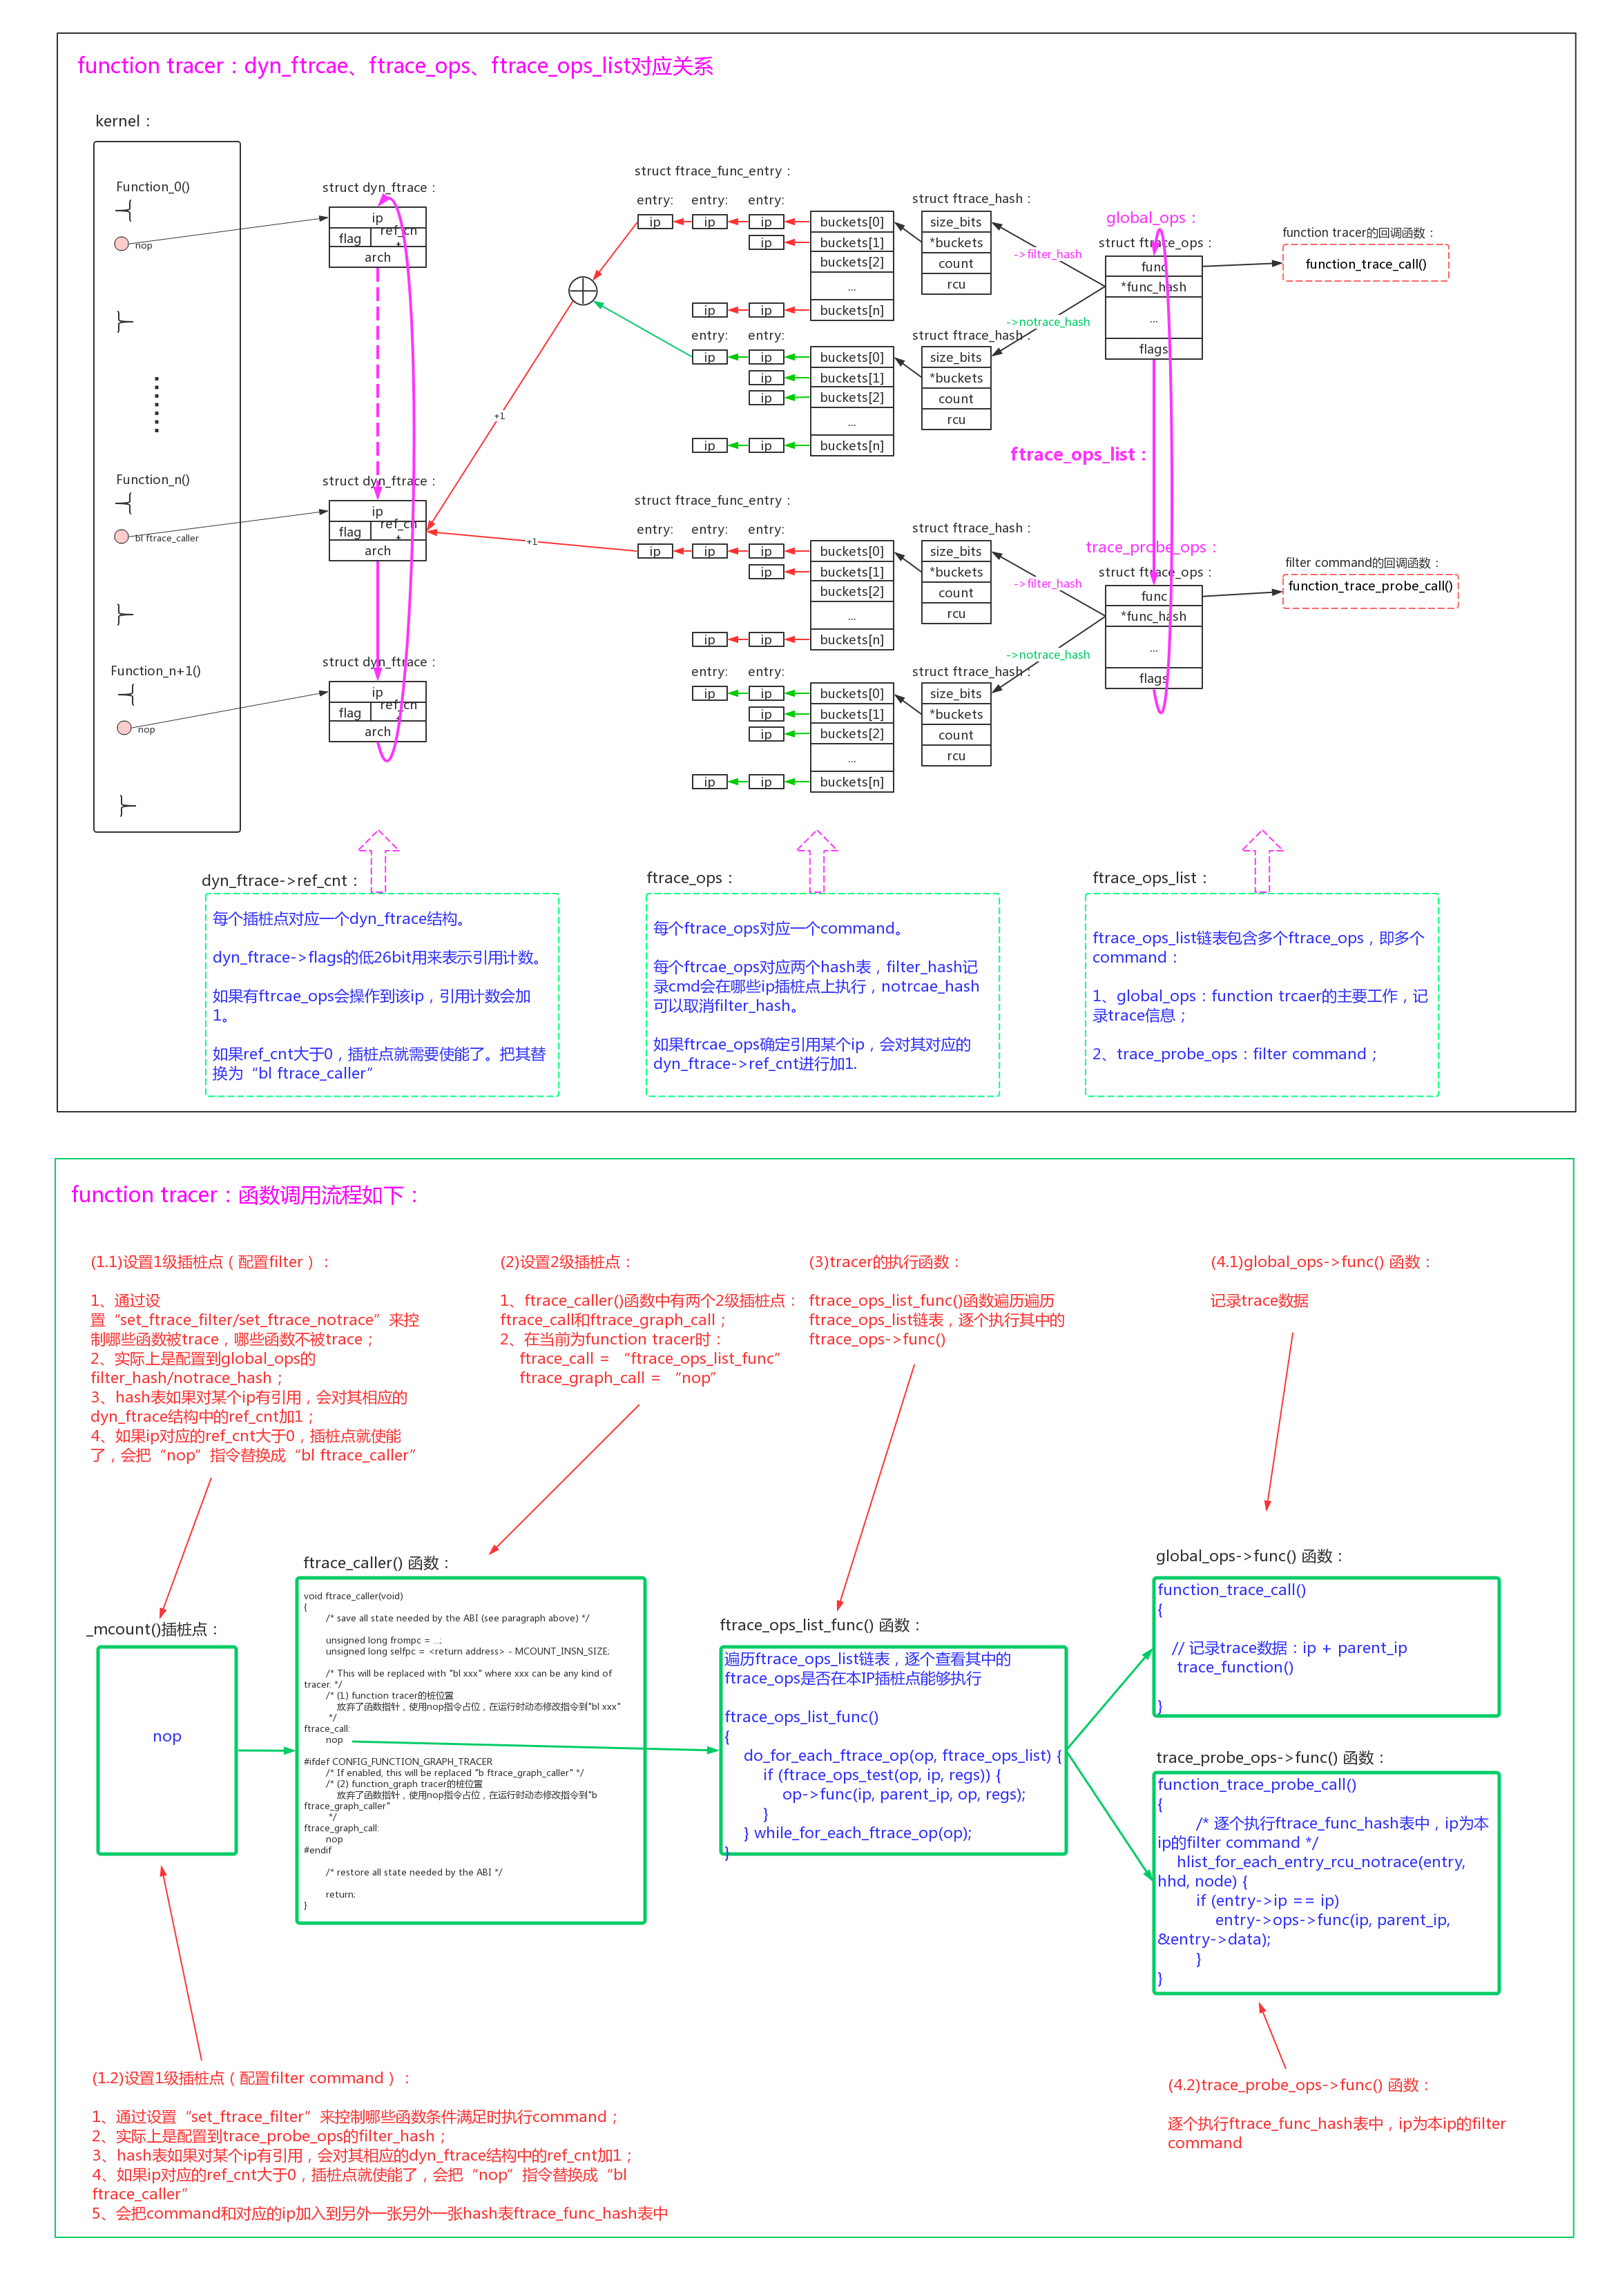
- 1、每个“bl _mcount”的插桩点ip对应一个每个插桩点对应一个dyn_ftrace结构。dyn_ftrace->flags的低26bit用来表示引用计数,如果有ftrcae_ops会操作到该ip,引用计数会加1。如果ref_cnt大于0,插桩点就需要使能了,把其替换为“bl ftrace_caller”;
- 2、ftrcae_ops采用hash表来表达对ip的引用,一个ftrcae_ops有两张hash表filter_hash和notrace_hash,综合的结果就是对ip的引用。function tracer模式时,有两个可能的ftrcae_ops:global_ops、trace_probe_ops。两个中任意一个引用到ip,都会造成ip的1级插桩点被替换为“bl ftrace_caller”;
- 3、通过设置“set_ftrace_filter/set_ftrace_notrace”会造成对global_ops的filter_hash/notrace_hash的配置,它的作用是配置function tracer的filter;
- 4、通过设置“set_ftrace_filter”会造成对trace_probe_ops的filter_hash的配置,它的作用是配置filter command,并且会把command和对应的ip加入到另外一张另外一张hash表ftrace_func_hash表中;
- 5、ftrace_caller()有两个2级插桩点:ftrace_call、ftrace_graph_call。在function tracer模式时,只有ftrace_call被设置成“bl ftrace_ops_list_func”;
- 6、ftrace_ops_list_func()的工作就是遍历ftrace_ops_list链表,逐个执行其中的ftrace_ops->func()。
- 7、global_ops的->func()函数为function_trace_call(),记录trace数据:ip + parent_ip;
- 8、trace_probe_ops的->func()函数为function_trace_probe_call(),逐个执行ftrace_func_hash表中,ip为本ip的filter command。
有以下几种场景,涉及到插桩点的动态管理:
- tracer的使能。当使用“echo xxx_tracer > current_tracer”时,会关闭旧的current tracer并使能新的tracer。典型的包括function tracer合入function_graph tracer;
- filter的配置。使用“echo function_name > set_ftrace_filter/set_ftrace_notrace”,可以配置部分function被trace,而不是所有function被trace;
- filter command的配置。使用“echo ‘!__schedule_bug:traceoff’ > set_ftrace_filter”,类似命令可以配置条件触发的command,当条件满足后command会被执行;
下面我们看看具体场景下的代码实现细节:
1.2.3、tracer注册
1、tracer注册。tracer可以通过register_tracer()进行注册。
以function tracer为例,kernel/trace/trace_functions.c:
1 | static struct tracer function_trace __tracer_data = |
register_tracer()的实现,kernel/trace/trace.c:
1 | int __init register_tracer(struct tracer *type) |
1.2.4、tracer使能
2、tracer使能。我们可以使用“echo function > current_tracer”命令来使能或者切换tracer。
来具体看看其代码实现:
1 | trace_create_file("current_tracer", 0644, d_tracer, |
1.2.5、function tracer使能
3、function tracer的使能。本质上是global_ops的注册后使能。
在初始化的时候,把global_trace的->ops初始化成了global_ops。
1 | start_kernel() -> trace_init() -> tracer_alloc_buffers: |
继续分析t->init(),以function tracer为例,调用到function_trace_init():
1 | static int function_trace_init(struct trace_array *tr) |
1.2.6、配置function tracer的filter
4、通过“set_ftrace_filter”、“set_ftrace_notrace”设置function trcer的filter。本质上是操作global_ops的filter_hash、notrace_hash。
1 | /* global_ops注册成inode->i_private */ |
“set_ftrace_filter”、“set_ftrace_notrace”的文件操作有个技巧,就是在open的时候分配一个临时hash表iter->hash来拷贝global_ops的filter_hash/notrace_hash的内容,在write操作实际设置filter时对iter->hash操作,在close的时候使用新的hash表iter->hash来更新global_ops。
open文件操作中对global_ops hash表的备份操作:
1 | static int |
write文件操作中对iter->hash表的更新操作:
1 | ftrace_filter_write() -> ftrace_regex_write() |
close文件操作中对global_ops hash表的更新操作:
1 | int ftrace_regex_release(struct inode *inode, struct file *file) |
1.2.7、配置function tracer的filter command
5、通过“set_ftrace_filter”设置function trcer的filter command。本质上向trace_probe_ops注册cmd,以及操作trace_probe_ops的filter_hash、notrace_hash。
虽然同样是操作set_ftrace_filter,但是配置filter和配置filter command是操作到不同的实体:
- 配置filter。操作的是global_ops的filter_hash/notrace_hash的内容;
- 配置filter command。是把command向trace_probe_ops注册,并且操作trace_probe_ops的filter_hash/notrace_hash的内容;
在配置filter command之前首先得注册command:
1 | init_function_trace() -> init_func_cmd_traceon() |
我们以”traceon”command为例,继续分析上一节对“set_ftrace_filter”的文件操作:
1 | static int ftrace_process_regex(struct ftrace_hash *hash, |
trace_probe_ops在被调用的时候,执行ftrace_func_hash中的filter command:
1 | ftrace_caller() -> ftrace_ops_list_func() -> __ftrace_ops_list_func() |
1.3、数据存入
function tracer的数据存入的路径为:
ftrace_caller() -> ftrace_ops_list_func() -> __ftrace_ops_list_func() -> global_ops->func() -> function_trace_call():
1 | static void |
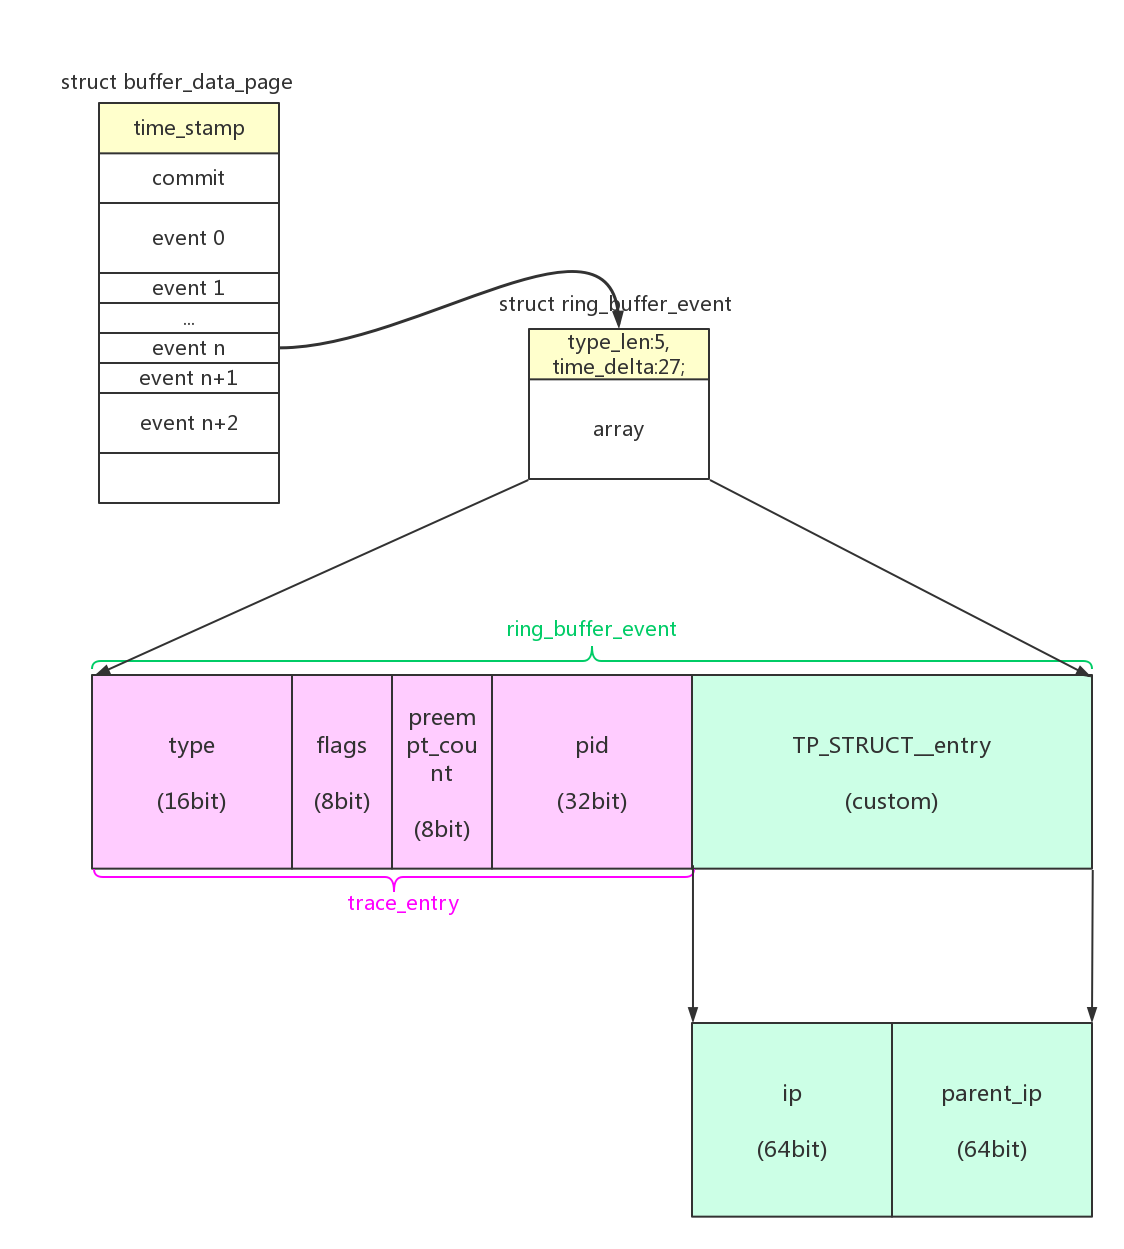
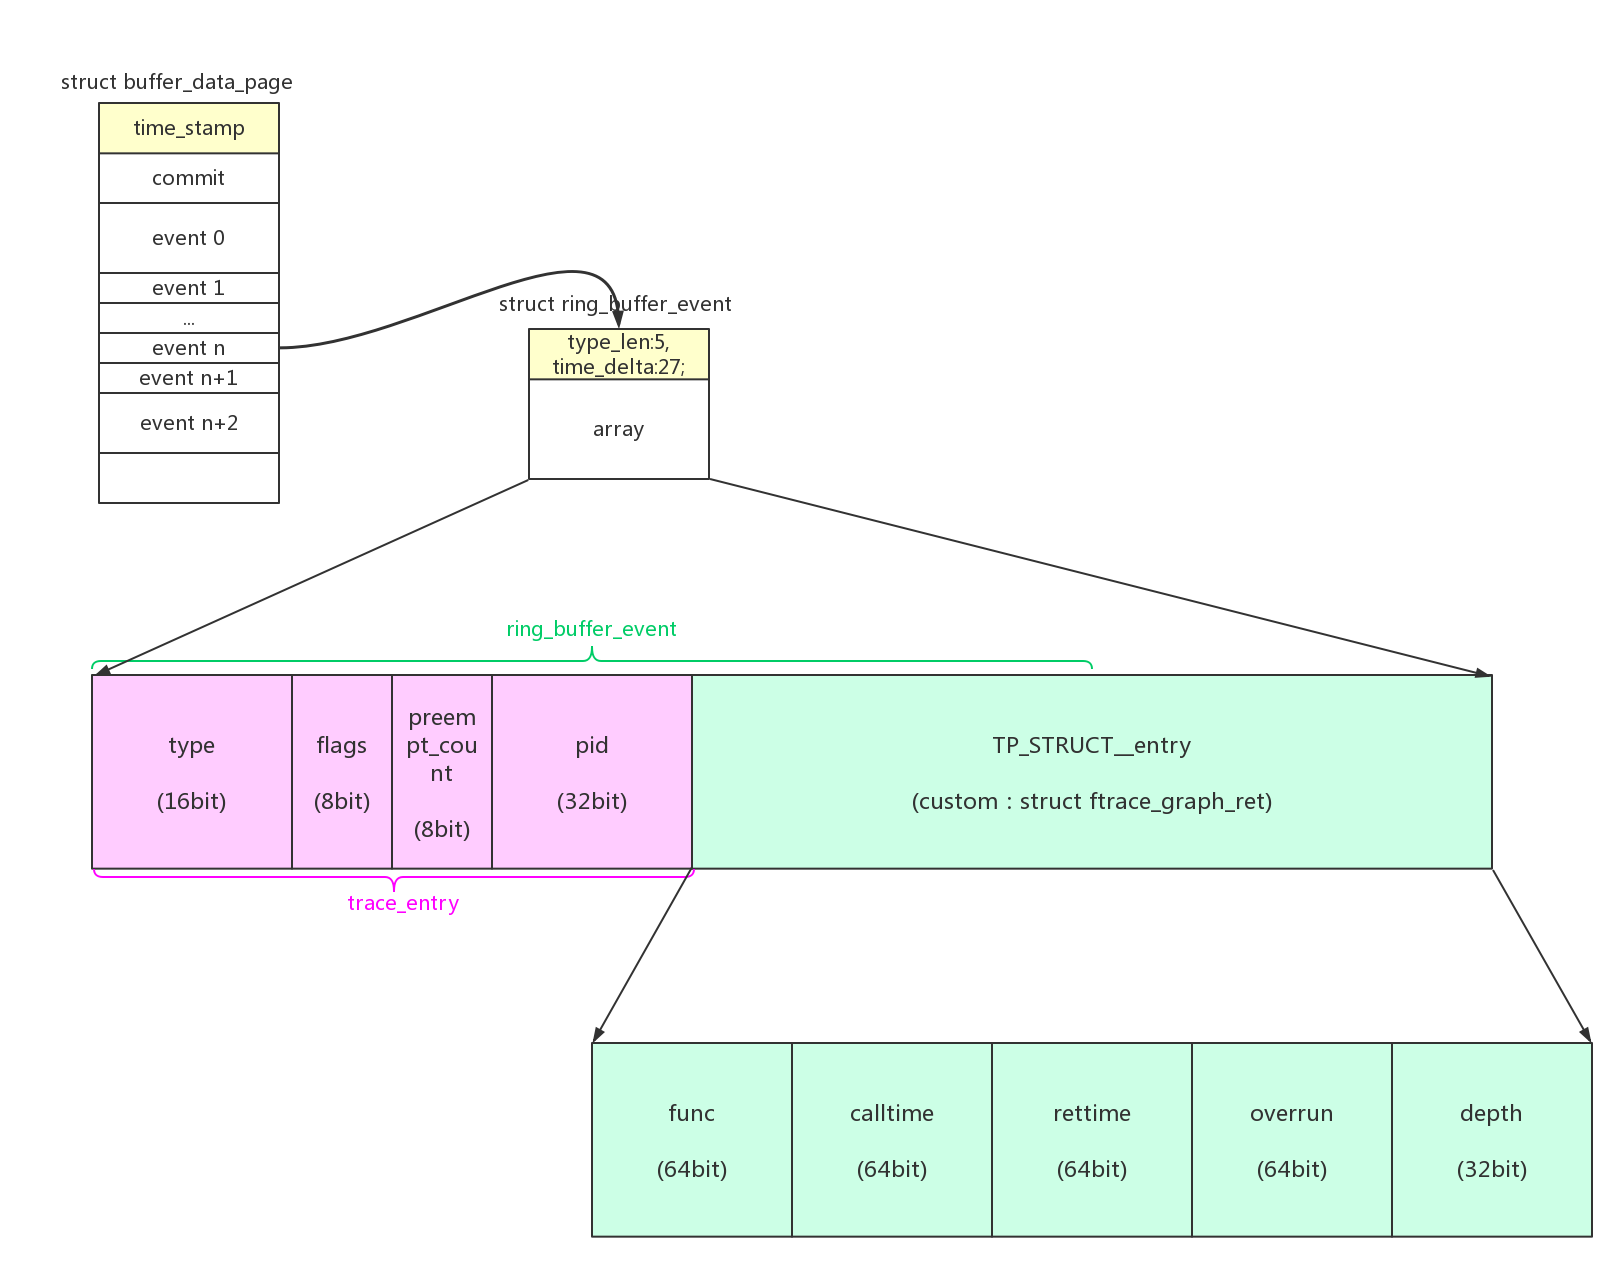
1.3.1、数据格式
function tracer自定义的trace数据非常简单:ip、parent_ip
1.3.2、filter
关于filter和filter command的配置在1.2.2、插桩点的动态管理一节已经讲得非常详细了,这里就不再重复。
1.4、数据读出
从trace文件读出的function tracer默认数据格式为:
1 | # cat trace |
在kernel/trace/trace_ouput.c文件中,注册了系统默认的几种trace_event。function tracer使用TRACE_FN类型的trace_fn_event:
1 | static struct trace_event *events[] __initdata = { |
在数据读出时,会调用到event对应的event->funcs->trace()函数,seq_read() -> s_show() -> print_trace_line() -> print_trace_fmt() -> event->funcs->trace():
TRACE_FN,event->funcs->trace()对应trace_fn_trace():
1 | /* TRACE_FN */ |
2、function_graph tracer
function_graph tracer从function tracer发展而来,function tracer使用“_mcount”插桩可以跟踪到每个函数的调用入口,而function_graph tracer即可以跟踪到函数的入口还可以跟踪到函数的返回。
2.1、插桩原理
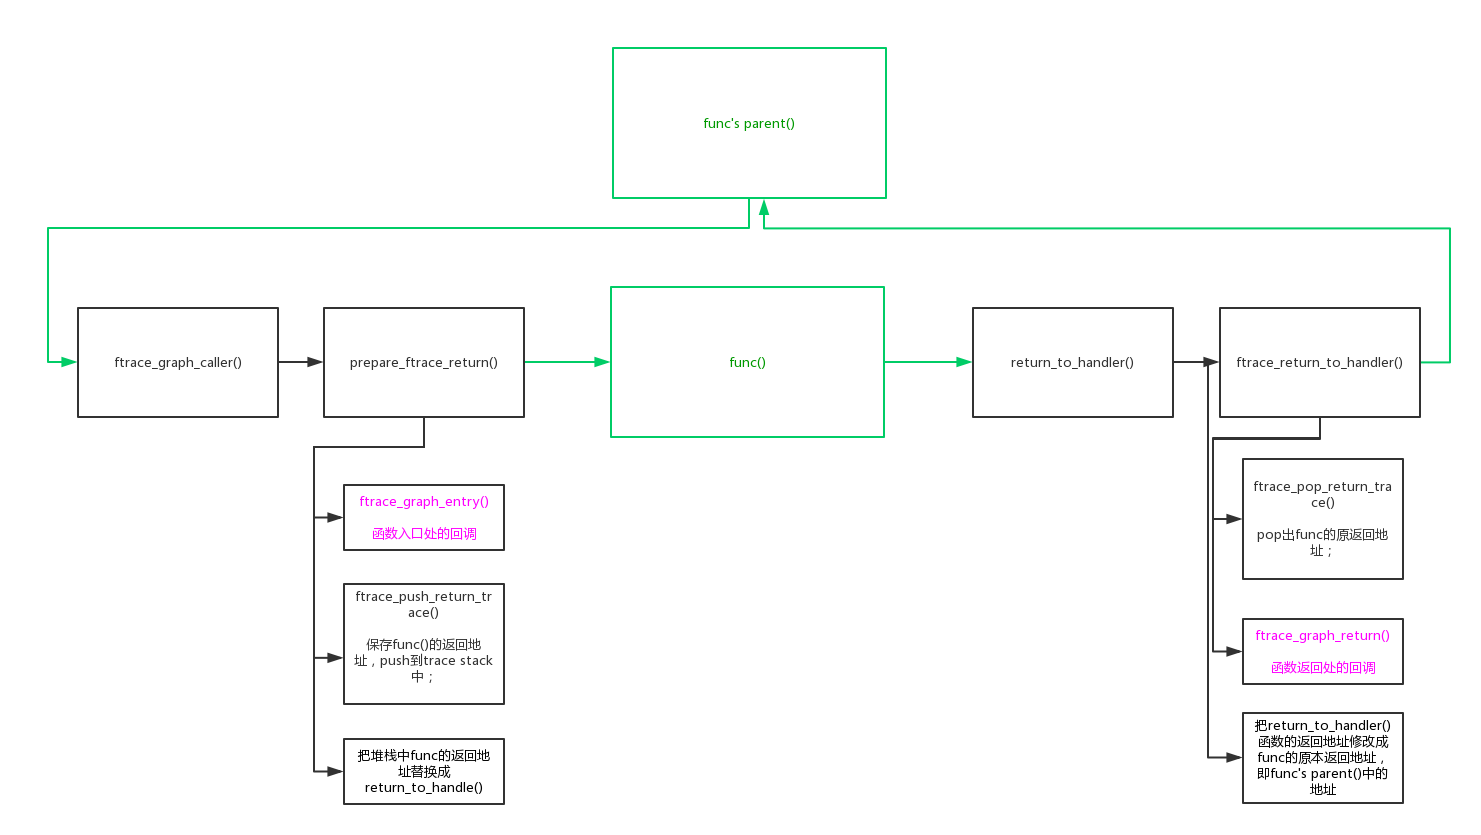
如上图:一切的关键是在入口桩函数被调用时,修改了func()的返回地址,不是返回到func’s parent()函数继续去执行,而是返回到reurn桩函数return_to_handler()中。return_to_handler()中执行完自己的return处理函数以后,再把返回地址恢复成func’s parent中的地址,返回继续执行原有的路径。
原本的入口处插桩,只能追踪到函数的切换。现在入口、出口同时插桩,还能获得函数的执行时长,做更多的分析。
2.2、插桩点管理
function_graph tracer插桩点动态管理的原理:
- 1、每个“bl _mcount”的插桩点ip对应一个每个插桩点对应一个dyn_ftrace结构。dyn_ftrace->flags的低26bit用来表示引用计数,如果有ftrcae_ops会操作到该ip,引用计数会加1。如果ref_cnt大于0,插桩点就需要使能了,把其替换为“bl ftrace_caller”;
- 2、ftrcae_ops采用hash表来表达对ip的引用,一个ftrcae_ops有两张hash表filter_hash和notrace_hash,综合的结果就是对ip的引用。function_graph tracer模式时,有一个的ftrcae_ops:graph_ops。并且graph_ops的hash表是直接引用global_ops的hash表,这样做的目的是可以保留function tracer模式时的filter配置。如果引用到ip,都会造成ip的1级插桩点被替换为“bl ftrace_caller”;
- 3、通过设置“set_ftrace_filter/set_ftrace_notrace”会造成对global_ops的filter_hash/notrace_hash的配置,它的作用相当于1级过滤。在function_graph tracer模式时,通过2级过滤的函数才能记录trace信息:1级过滤(函数必须是“set_ftrace_filter/set_ftrace_notrace”配置中允许的函数),2级过滤(函数必须是“set_graph_function/set_graph_notrace”配置中允许的函数或者是被它们调用的子函数);
- 4、通过设置“set_graph_function/set_graph_notrace”可以配置2级过滤,实际上是配置到ftrace_graph_funcs[]/ftrace_graph_notrace_funcs[]表中。
- 5、ftrace_caller()有两个2级插桩点:ftrace_call、ftrace_graph_call。在function tracer模式时,只有ftrace_graph_call被设置成“bl ftrace_graph_caller”;
- 6、ftrace_graph_caller()的工作就是设置环境,让函数在入口处调用trace_graph_entry(),在返回处调用trace_graph_return();
- 7、在trace_graph_entry()中会进行2级过滤的合法性判断,函数必须是“set_graph_function/set_graph_notrace”配置中允许的函数或者是被它们调用的子函数才能继续执行,否则出错返回后面的trace_graph_return()都不会被执行。
- 8、trace_graph_entry()、trace_graph_return()的工作都是记录trace信息:ip+时间戳;
在以下场景时,function_graph会涉及到对各个插桩点的动态修改:
- tracer的使能。当使用“echo xxx_tracer > current_tracer”时,会关闭旧的current tracer并使能新的tracer。典型的包括function tracer合入function_graph tracer;
- function_graph filter的配置。使用“echo function_name > set_ftrace_filter/set_ftrace_notrace”,可以配置部分function被trace,而不是所有function被trace;
- function filter的配置。使用“echo function_name > set_graph_function/set_graph_notrace”,可以配置部分function被trace,而不是所有function被trace;
下面我们看看具体场景下的代码实现细节:
2.2.1、function_graph tracer使能
参考“1.2.5、function tracer使能”这一节,tracer的使能最后调用的是tracer->init()函数。
对function_graph tracer来说,调用的是graph_trace_init():
1 | static struct tracer graph_trace __tracer_data = { |
2.2.2、配置function filter(1级过滤)
因为function_graph tracer的graph_ops继续共用global_ops的hash表,使用“set_ftrace_filter/set_ftrace_notrace”接口可以配置global_ops的filter_hash/notrace_hash表。所以可以继续使用“set_ftrace_filter/set_ftrace_notrace”来配置function_graph tracer的filter。
function_graph tracer还可以使用“set_graph_function/set_graph_notrace”接口来配置过滤,需要两种过滤条件都满足的函数才能被trace。所以我们命名当前过滤为1级过滤。
具体的代码解析参考: 1.2.6、配置function tracer的filter
2.2.3、配置function_graph filter(2级过滤)
通过设置“set_graph_function/set_graph_notrace”可以配置2级过滤,实际上是配置到ftrace_graph_funcs[]/ftrace_graph_notrace_funcs[]表中。
1 | trace_create_file("set_graph_function", 0444, d_tracer, |
在trace_graph_entry()中会进行2级过滤的合法性判断,函数必须是“set_graph_function/set_graph_notrace”配置中允许的函数或者是被它们调用的子函数才能继续执行,否则出错返回后面的trace_graph_return()都不会被执行。
1 | int trace_graph_entry(struct ftrace_graph_ent *trace) |
2.3、数据存入
和function tracer不一样的是,function_graph在进入函数和返回函数时都有trace数据存入。
2.3.1、trace_graph_entry()
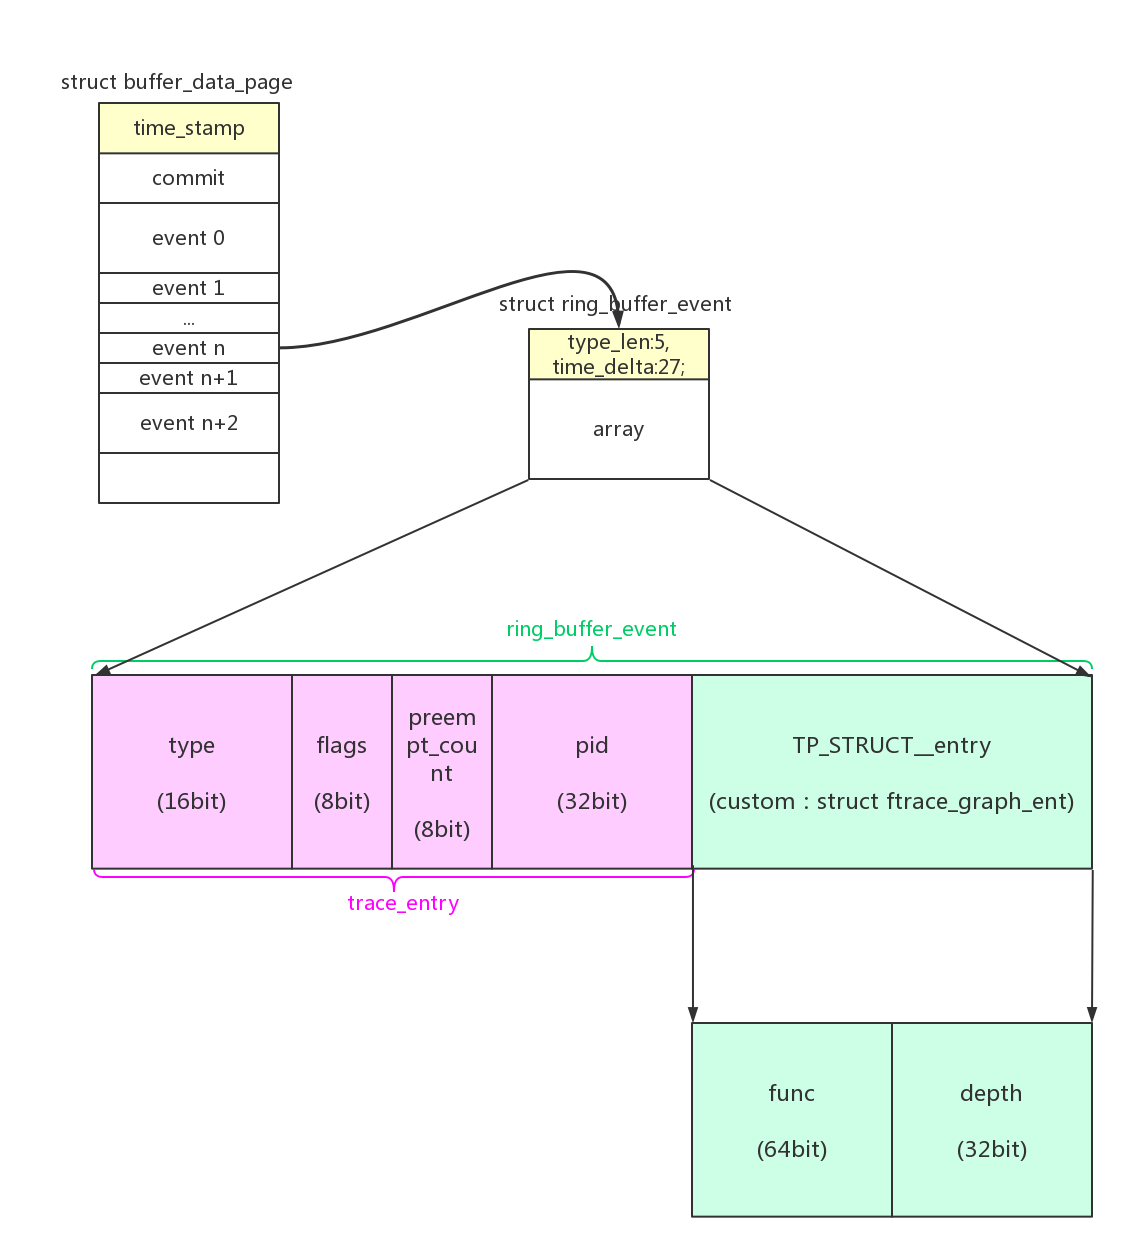
函数入口的存入:trace_graph_entry() -> __trace_graph_entry():
1 | int __trace_graph_entry(struct trace_array *tr, |
2.3.2、trace_graph_return()
函数返回的存入:trace_graph_return() -> __trace_graph_return():
1 | void __trace_graph_return(struct trace_array *tr, |
2.3.3、filter
参见“2.2.2、配置function filter(1级过滤)”和“2.2.3、配置function_graph filter(2级过滤)”。
2.4、数据读出
从trace文件读出的function_graph tracer默认数据格式为:(显示function_graph中设置的函数或者是被它们调用的子函数)
1 | # cat trace |
在通过trace文件读出数据时,如果tracer的print_line()函数有定义,则会调用print_line()函数进行解析。而不再去使用event->funcs->trace()函数。
1、读操作时,seq_read() -> s_show() -> print_trace_line() -> tracer->print_line():
1 | static struct tracer graph_trace __tracer_data = { |
2、在第一次读操作时,会打印header。seq_read() -> s_show() -> print_trace_line() -> tracer->print_header():
1 | static void print_graph_headers(struct seq_file *s) |
3、在open的时候,也会调用到tracer的open函数。tracing_open() -> __tracing_open() -> tracer->open():
1 | void graph_trace_open(struct trace_iterator *iter) |
3、irqsoff tracer
irqsoff tracer用来追踪最大关中断时间。它的trace会提供几部分信息:
- 1、irqoff的最大时长:latency;
- 2、在最大irqoff这期间所有的function trace信息;
- 3、最后的irqon的函数回调信息;
3.1、插桩
irqsoff tracer的插桩方法,是直接在local_irq_enable()、local_irq_disable()中直接插入钩子函数trace_hardirqs_on()、trace_hardirqs_off()。
1 | #ifdef CONFIG_TRACE_IRQFLAGS |
3.1.1、trace_hardirqs_on/off()
local_irq_disable() -> trace_hardirqs_off():
1 | void trace_hardirqs_off(void) |
local_irq_enable() -> trace_hardirqs_on():
1 | void trace_hardirqs_on(void) |
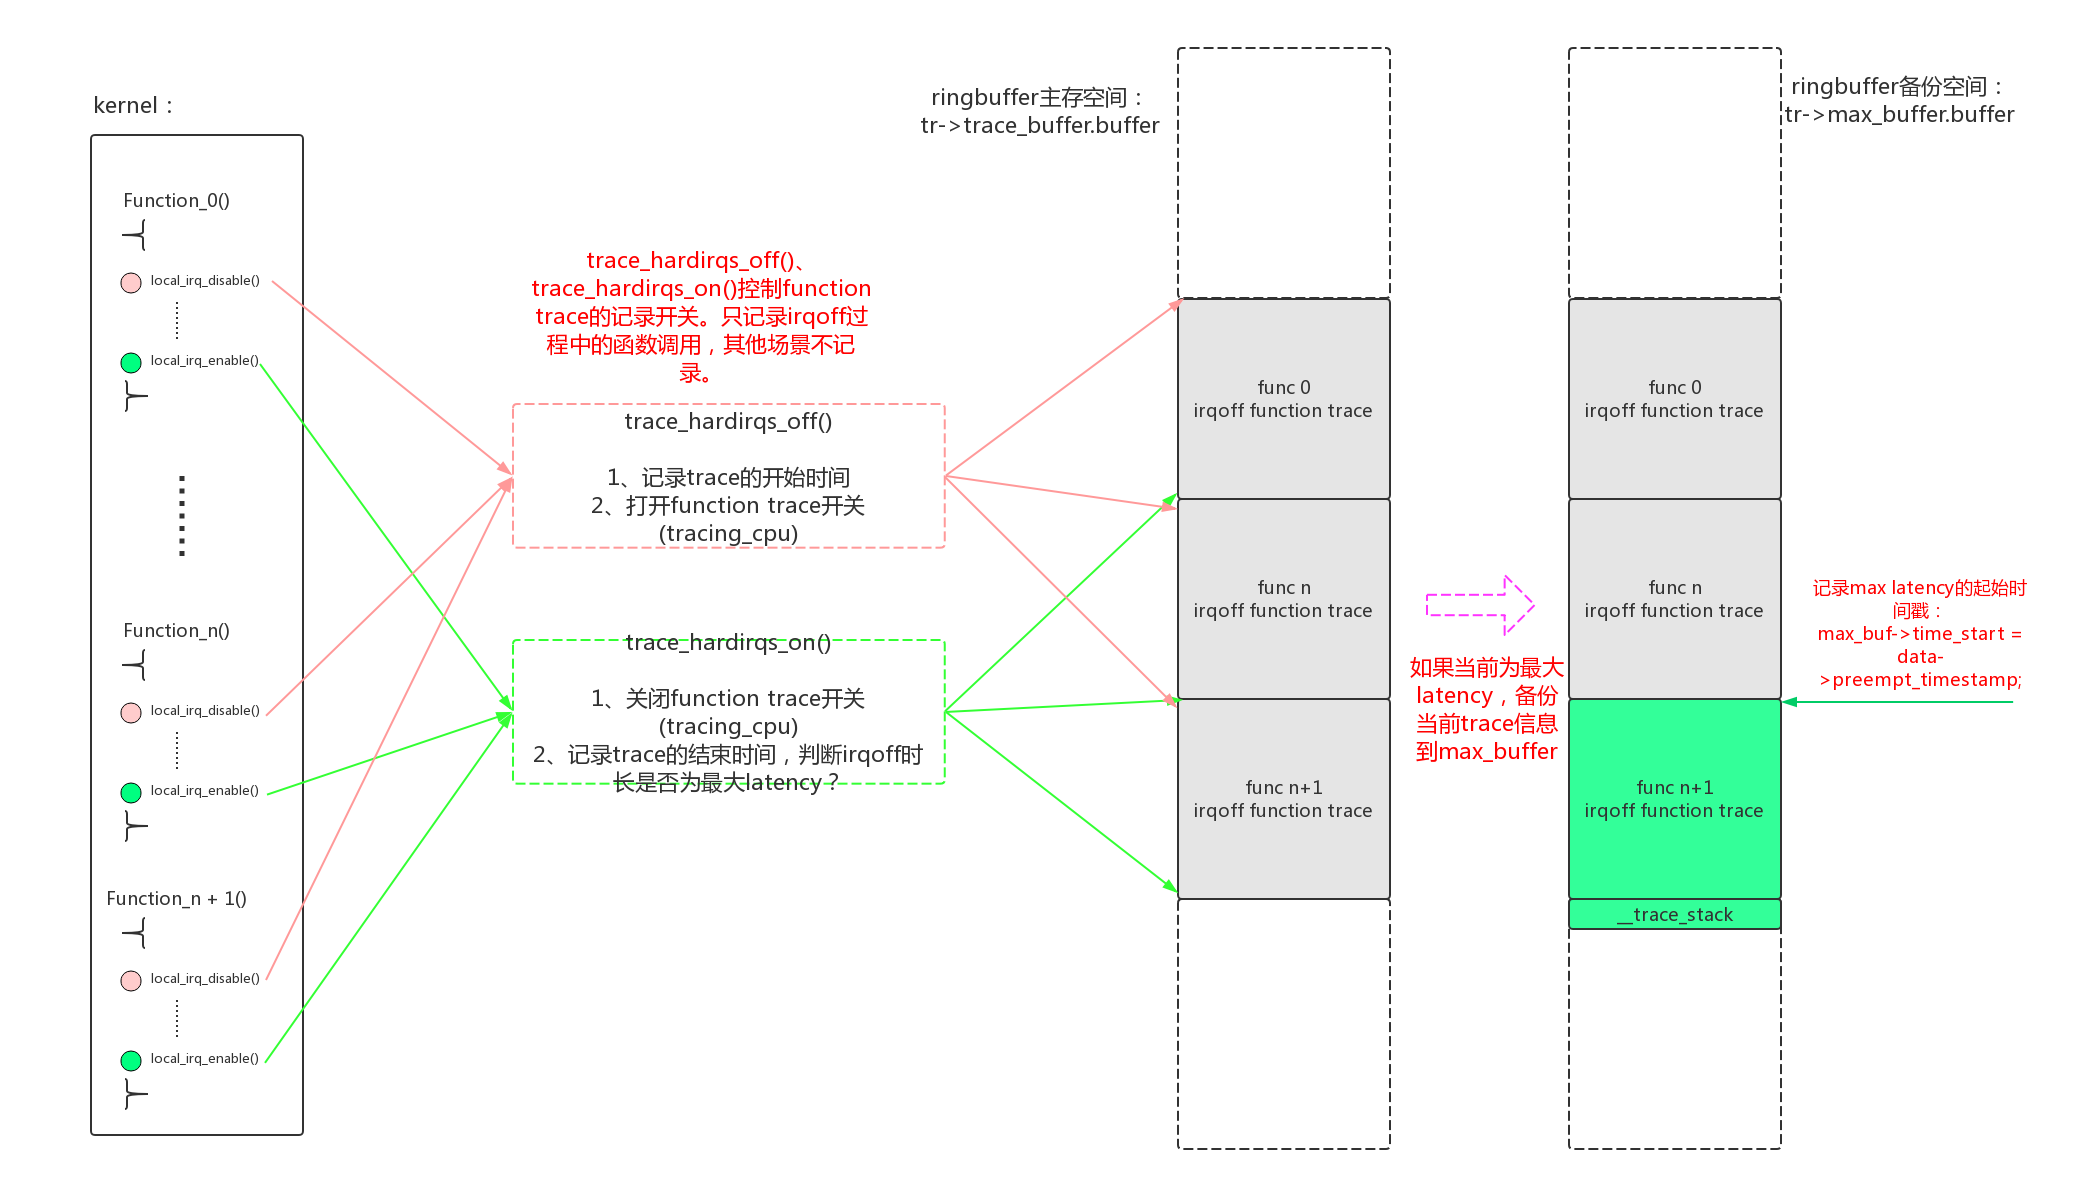
3.1.2、irqoff trace信息的读取
参考上一节,最大latency的trace信息被备份到了max_buffer中了,且max_buf->time_start来记录最大latency的起始时间。
所以在trace读取irqoff trace信息时,需要从max_buffer读取。tracing_open() -> __tracing_open():
1 | static struct trace_iterator * |
在读取时,还需要做时间同步只读取max_buf->time_start时间戳以后的数据。tracing_open() -> __tracing_open() -> tracing_iter_reset():
1 | void tracing_iter_reset(struct trace_iterator *iter, int cpu) |
3.1.3、irqsoff tracer的使能
- irqsoff tracer需要使用function trace或者function_graph trace来记录最大latency的中间函数调用过程。所以它会注册一个global_ops->func,或者使用graph_ops注册。
- trace数据的写入受trace_hardirqs_off()、trace_hardirqs_on()中配置的开关per_cpu(tracing_cpu, cpu)控制。在trace_hardirqs_off()时打开开关,在trace_hardirqs_on()时关闭开关,这样就记录下了irqoff过程中的具体函数调用过程。
参考“1.2.5、function tracer使能”这一节,tracer的使能最后调用的是tracer->init()函数。
对irqsoff tracer来说,调用的是irqsoff_tracer_init():
1 | static struct tracer irqsoff_tracer __read_mostly = |
在记录trace数据时,需要判断per_cpu(tracing_cpu, cpu)开关。以function trace模式为例,我们来看看其irqsoff_tracer_call()函数:
1 | static void |
3.2、数据存入
它的trace会提供几部分信息:
- 1、irqoff的最大时长:latency;
- 2、在最大irqoff这期间所有的function trace信息;
- 3、最后的irqon的函数回调信息;
具体的存入方法参考“3.1、插桩”这一节的描述。
3.3、数据读出
从trace文件读出的irqoff tracer默认数据格式为:(显示最大latency以及过程中的详细函数调用)
1 | # cat trace |
在通过trace文件读出数据时:
- 具体函数调用信息是使用trace_function()或者trace_graph_function()函数进行记录的,调用相应的方法解析即可;
- 最后的irqon的函数回调信息是使用__trace_stack()函数进行记录的,调用相应的方法解析即可;
- 最大latency信息的解析,使用tracer->print_header();
在第一次读操作时,会打印header。seq_read() -> s_show() -> print_trace_line() -> tracer->print_header():
1 | static void irqsoff_print_header(struct seq_file *s) |